The recently released 2019 ACC/AHA Guideline on the Primary Prevention of Cardiovascular Disease recommends a healthy plant-based or Mediterranean-like diet high in vegetables, fruits, nuts, whole grains, lean vegetable or animal protein (preferably fish), and vegetable fiber. Sound familiar?
No matter how much people know about heart-healthy eating, the hard part is putting it into practice. Show them how to remake their favorite dishes with a heart-healthy cooking demo.
Why cooking demos? Because we think there’s no better way to get the message across than with food. Show people how to cook, let them taste healthy food, and they’re more likely to try it at home.
Cooking demos are great for:
- Employee lunch-and-learns
- Community classes
- Parent nights at school
- Health fairs
- Home school groups
- Women’s shelters
- Food pantries
- Afterschool programs
- Drug/alcohol rehab
- Church groups
- Senior centers
Cooking in front of a crowd may sound daunting, but our Cooking Demo Book and CD Kit will make you look like a Food Network Star. The 300+ page book contains more than 30 lessons plus PowerPoint shows on Recipe Modification and Menu Planning & Shopping Tips.
Each lesson includes:
- Leader guide
- Recipes (tested and simple, with easy-to-find, affordable ingredients)
- Make-ahead & presentation tips
- Shopping & equipment lists
- Handouts
For heart-healthy eating, we suggest the lessons on:
- High fiber
- Fish
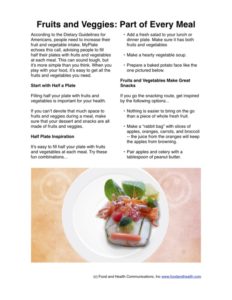
- Fruits & veggies
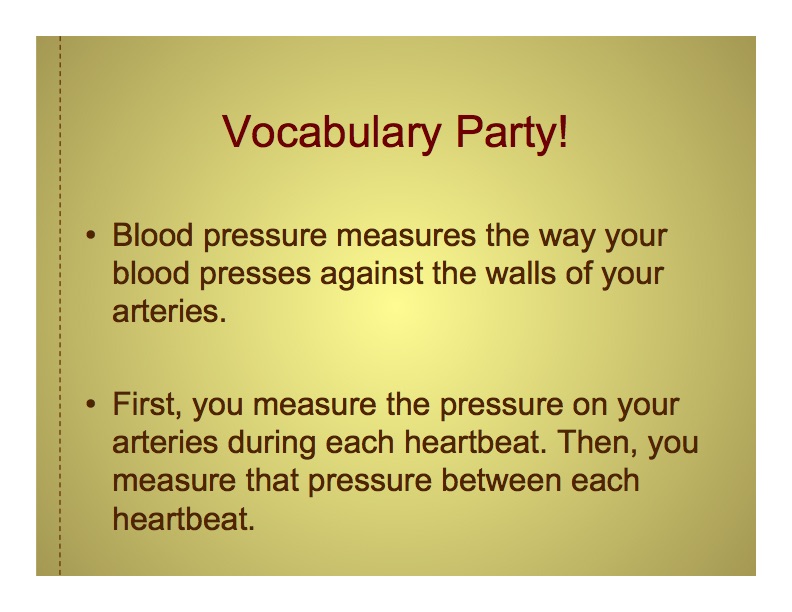
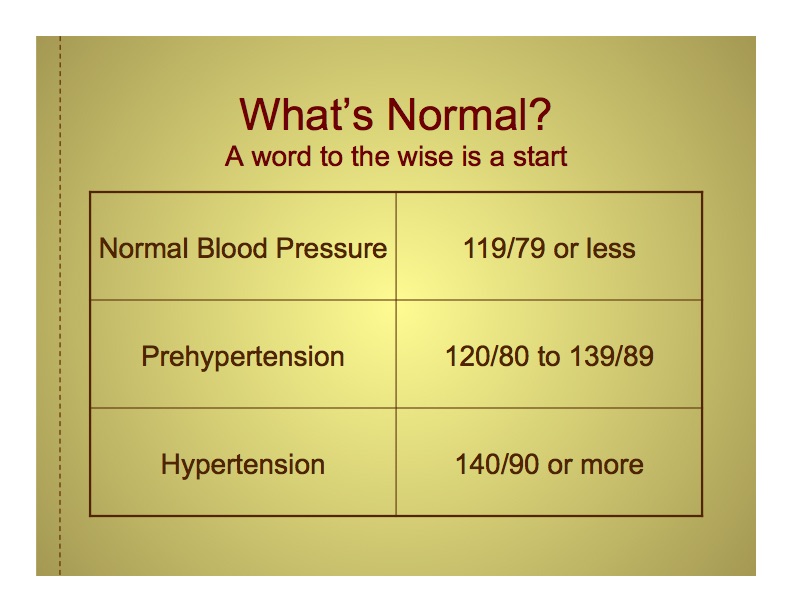
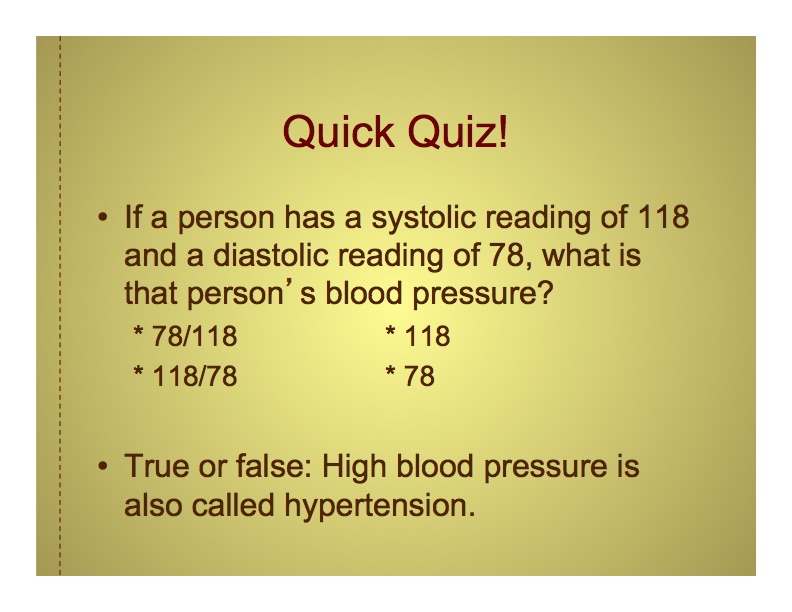
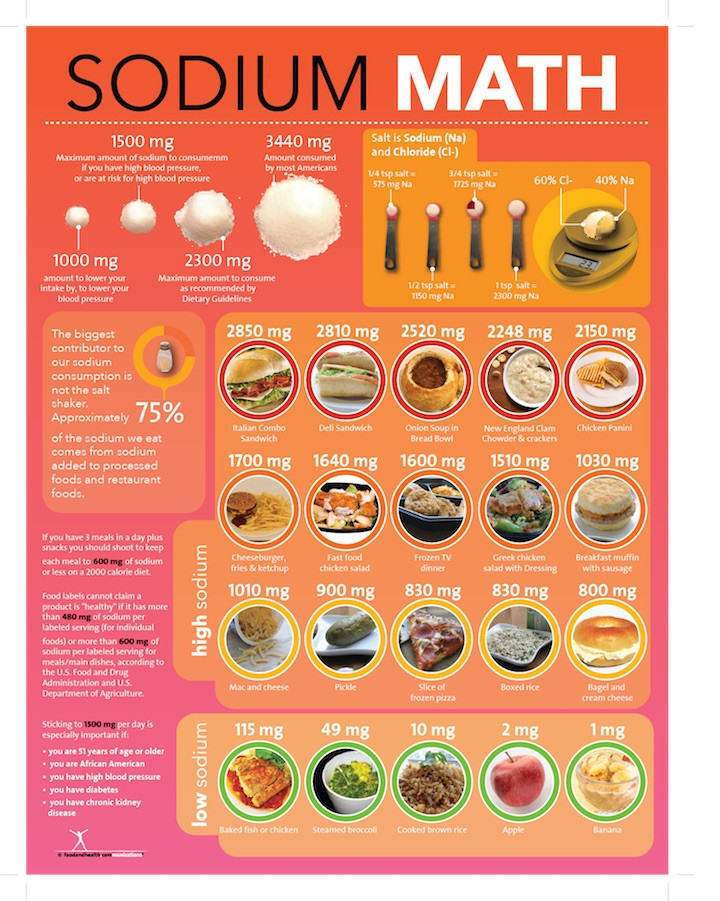
- Hypertension
- Vegetarian cooking
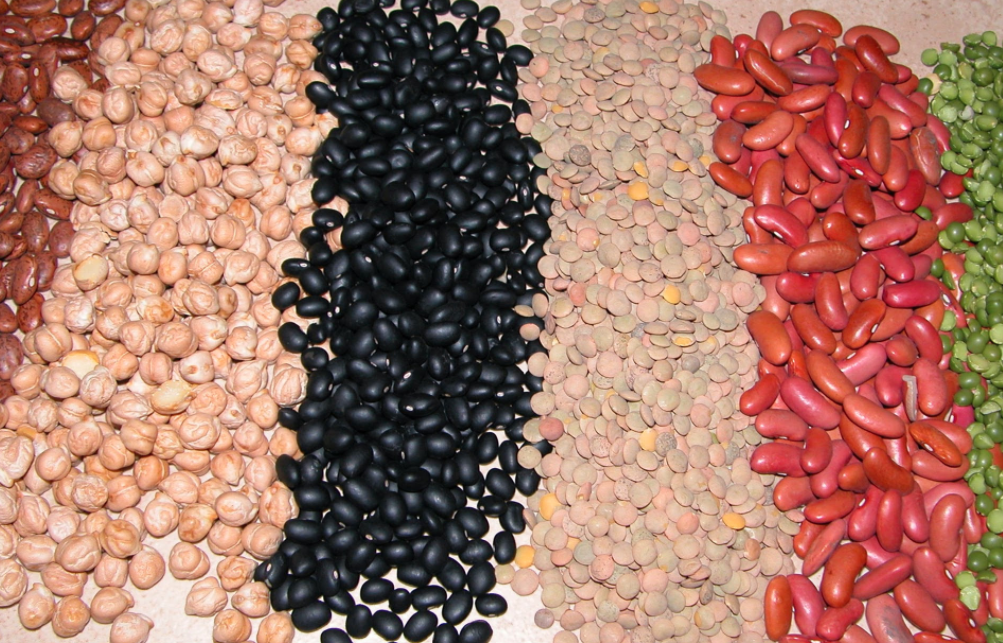
- Beans
- Grains
- Recipe modification
- Heart healthy recipes
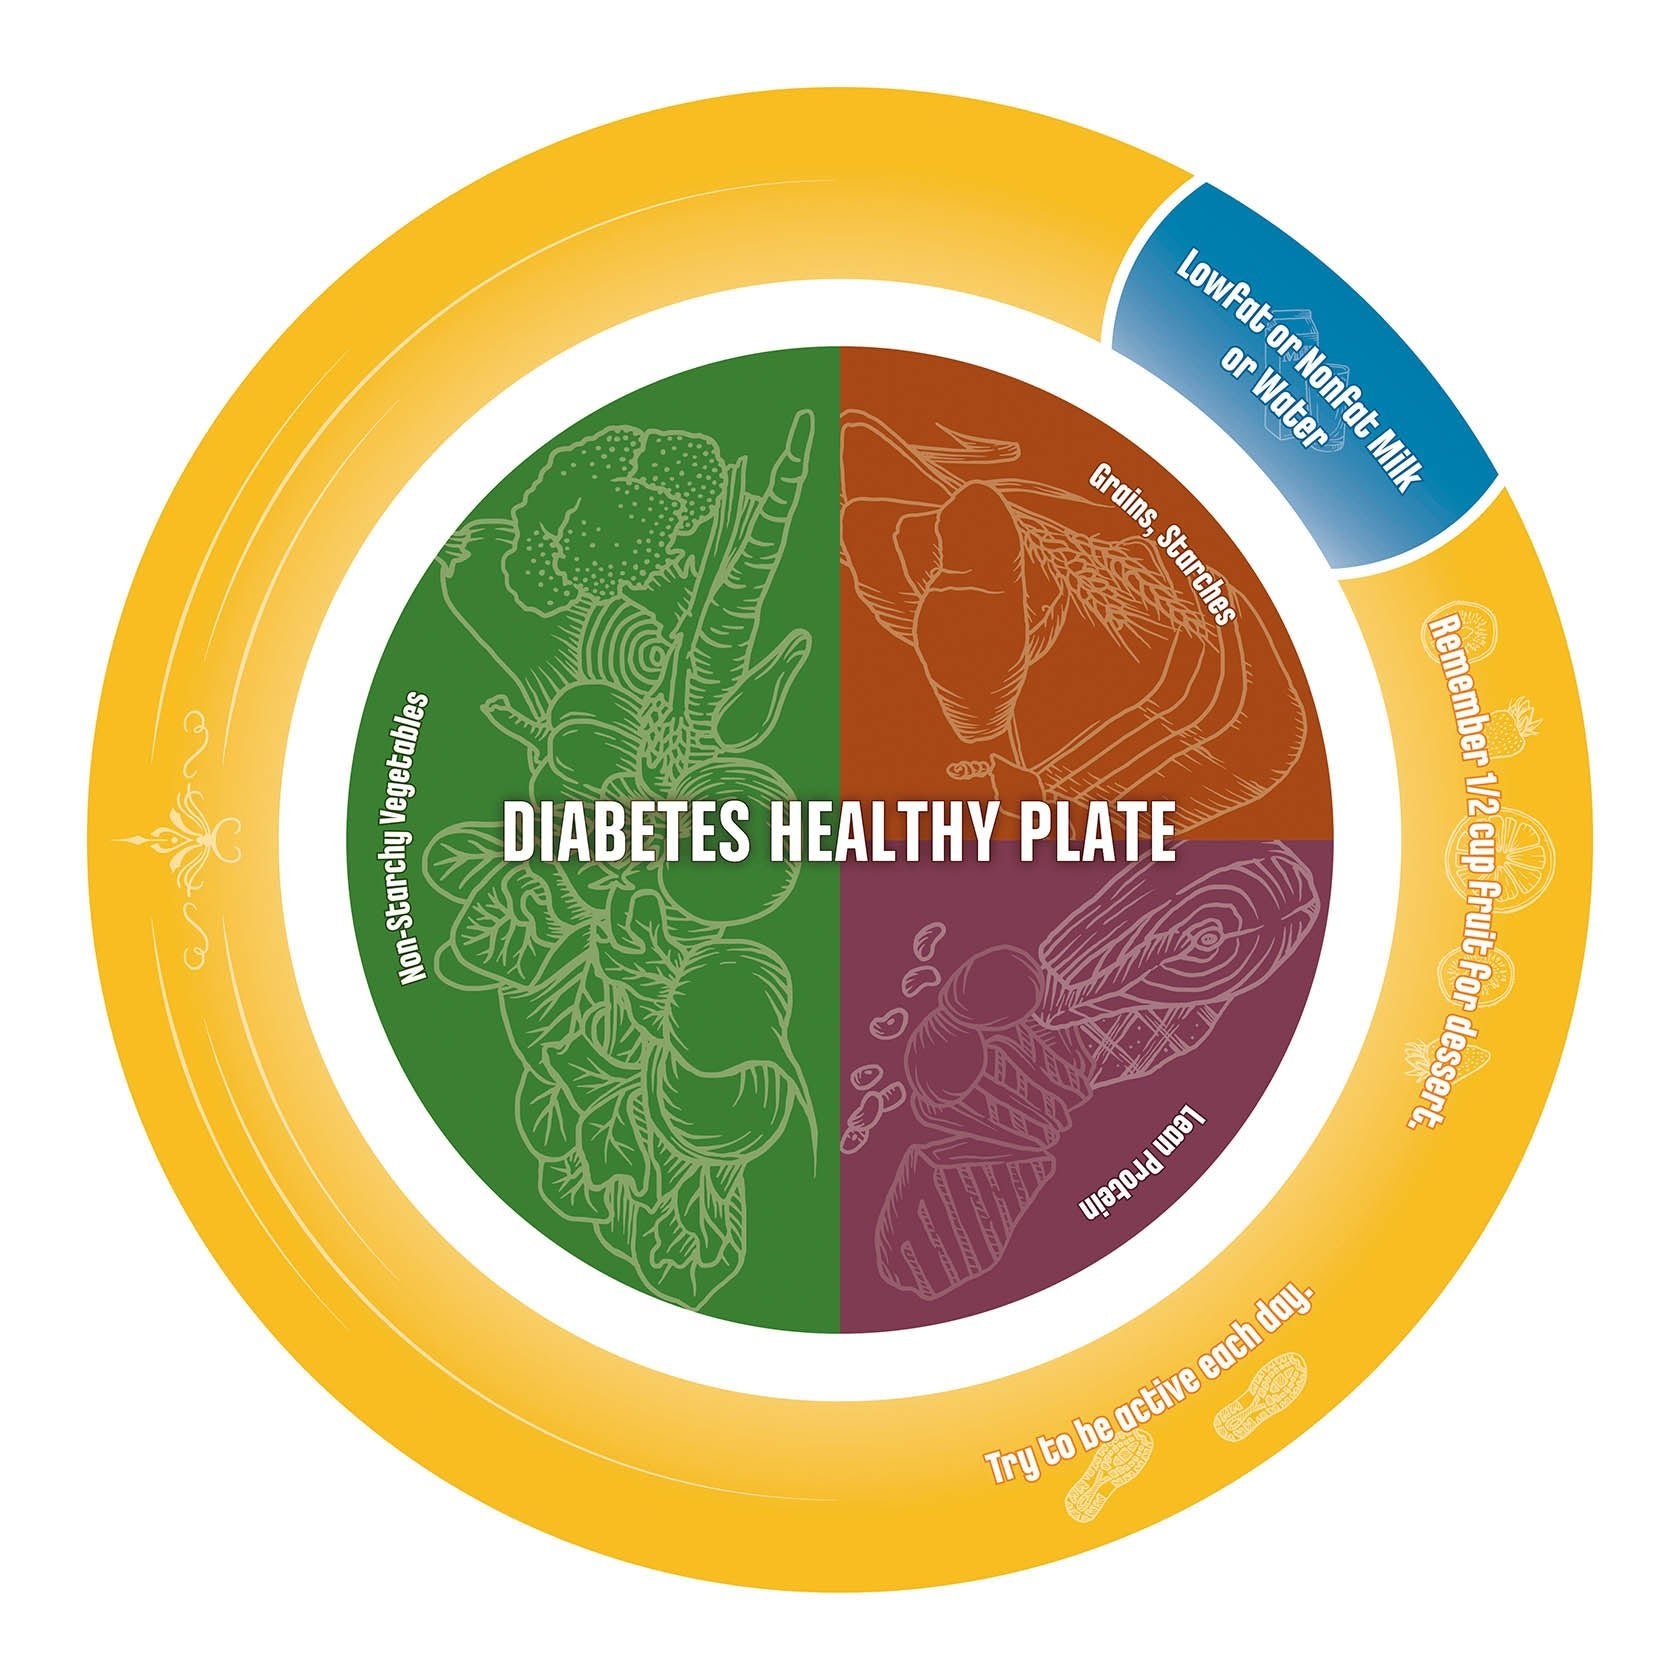
- Meet MyPlate
For makeovers, it is always great to show these switches, featured in all of our cooking demo kits:
- Whole milk to skim milk
- Butter to olive oil
- A little grated Parmesan cheese instead of a lot of grated regular cheese like mozzarella or cheddar
- Adding more veggies for most recipes
- Lean ground beef or turkey instead of regular ground beef
- Using more beans instead of meat
You’ll also want to check out our MyPlate Cooking Demo Book & CD, Home Run Cooking Book and Demo Program, and Cooking Demo Toolkit.
Get 15% off all heart health education materials now through the end of March 2019!