Don’t Get Hooked by the See-Food Diet

A school nurse recently bought our See Food Diet Poster. She says she is trying to get all the kids on a good schedule with eating right, sleeping, and learning after all the challenges of the COVID-19 pandemic.

In fact, she loves this poster so much that we made it into a banner for her – yes, all our posters are also available as banners!

The See Food poster features a beautiful fish swimming along in the sea. The fish is tempted by hook after hook baited with not-so-healthy food choices like soda, chili dogs, cake, and candy.

But if the fish takes its eyes off the junk food, it will find a treasure chest spilling over with healthier food choices.

The message? Don’t eat everything you see. Don’t get hooked!

Kids (and adults!) will love this colorful and fun poster. You can use it to generate discussions about:

  1. The food industry and how junk food and fast food are formulated to tempt your tastebuds.
  2. Mindful eating and how to pause instead of automatically taking the bait of unhealthy food.
  3. Planning ahead so you always have healthy foods handy.
  4. Using portion control so you can have occasional treats without overdoing it.
  5. Healthier options at restaurants and convenience stores, for those times when you find yourself hungry and away from home.

By Hollis Bass, MEd, RD, LD

Healthier choices are as easy as 1-2-3

Our Healthier Choices 123 materials provide a simple way to encourage people to make healthy lifestyle changes. The three step concept is perfect for all audiences, from busy, budget-conscious adults to short-attention-span kids.

Set up a health fair or table display with the Healthier Choices 123 poster or banner as the focal point. Then add an activity to go along with each step. Here are some ideas:

Step 1 – Drink water instead of sugary drinks.  

  • Fill an empty 20oz soda bottle with 16 teaspoons of sugar. Compare that to a bottle of water that has zero teaspoons of sugar.
  • Energy drinks, teas, and sports drinks can have as much sugar as soda. Display bottles and cans of these beverages so people can check the grams of sugar per serving.
  • Choose alternatives: water (add fruit or herbs) or unsweetened tea. Have a pitcher of ice water, small cups, and some cut up fruit for people to add.
  • Replacing one can of soda per day with water saves more than 50,000 calories in a year. Think of the money you’ll also save (tap water is free!).

Step 2 – Choose activity instead of screens.

  • How many more calories do you burn by moving instead of sitting? At least twice as many!
  • Replacing 30 minutes of screen time with 30 minutes of brisk walking will help you burn an extra 40,000+ calories per year.
  • Write different 10-minute activities on small pieces of paper or index cards (walk the dog, do laundry, vacuum, shoot baskets, etc). Fold them and put them in a large bowl or jar. Let each person take out three. When they do all three in a day, they’ll have moved for 30 minutes.

Step 3 – Choose fruits and veggies instead of sugary or fried foods.

  • Fruits and vegetables have fewer calories but more nutrients compared to foods like chips, French fries, and cookies.
  • Replacing a bag of chips with an apple will save you 25,550 calories per year.
  • Use food models, pictures, or real food to compare calories in fruit- and vegetable-rich meals vs higher fat choices. For example, you could show two meal choices at McDonald’s: a southwest grilled chicken salad (350 calories) vs a double cheeseburger & medium fries (770 calories).

As a take-home message, set out blank index cards and colorful markers. Ask people to write or draw the healthier choice they plan to make for each step. Tell them to keep the card in their wallet or on their refrigerator – wherever it will remind them of the changes they want to make.

Click here to get 15% off this collection for the first week of April 2019.

Fruit: Nature’s Fast Food

I’ve got a fun new poster in the store, and today I want to share a little bit about it with you!

First things first, here’s my latest creation:

I was inspired by the fresh produce available last summer at one of my local markets, so when I got home I couldn’t resist setting up a quick still life to highlight these tasty stone fruits at their peak.

Imagine my surprise when this print won 1st place in the Open Print category of the 2016 Annual Print Competition at the Palo Alto Camera Club. Ron Herman was the judge, and I was completely floored by his decision.

Soon after this picture won, I decided to feature it in my gallery showing this past winter. The showing was titled “A Visual Feast” and took place at the Avenue 25 Gallery in San Mateo California. In fact, if you look closely, you can see this photo hanging with a few other favorites in the picture below.*

I was so proud of this original photo that I decided to turn it into a poster. But what to call it?

I wanted to steer clear of additional artistic commentary and let the image speak for itself, so I focused my brainstorming on key health lessons and nutrition topics. Then, out of the blue, it hit me. Fruit is nature’s fast food! I often grab a peach or a handful of cherries on my way out the door or to snack on as I work at my desk, and I realized that these snacking habits had — over time — gradually replaced my reliance on fast food. I’m sure that this change in my routine was great news for my health, and so now I want to share that epiphany with your clients in order to encourage them to also change their habits.

And that’s how this poster came to be. How will you use it?

* This image is copyright 2017 by Len Cook @expressionfood.com

And here are some other resources that can help make your life easier…

The Fat Poster Story

Lately, we have gotten a lot of requests for materials that show the levels of sugar and fat in foods. Of course, we set out right away to make great infographic posters that provide a sea of knowledge at a glance. Now we have the antidote to the fast food commercial right here!

Here are a few things we learned about fat and fast food along the way…

_FHC2360

  • The big double burgers are really heavy when you start carrying them around a photo studio. When you refrigerate one, it becomes very stiff. Most items from a fast food restaurant became sort of scary to us when they got cold, because the amount of fat became way more apparent. If only they would chill and dissect these things in high school!
  • There is a lot of fat and not much fiber in many popular menu choices. For every 1,000 calories you eat, you are supposed to get 14 grams of fiber, according to the Dietary Guidelines for Americans. In one 1,500 calorie jumbo meal (large fries, large drink, double burger) at a fast food restaurant, there were only 8 grams of fiber and 75 grams of fat. This means that roughly 45% of all the calories in that meal are from fat. That’s almost double the amount of fat and half the amount of fiber that should be in an ideal meal. The calories are about triple what the average person should eat in one meal too.
  • Size matters. You really could do better if you ordered a small burger, apples, and a drink that does not have added sugar. That meal would only have 270 calories and 9 grams of fat. It can be ordered as a kid’s meal, which means that you can still save money instead of ordering the jumbo value meal with 5X the calories!
  • The dressing packets for the salads are very big. We would never pour that much dressing on a salad. But if you do, it’s easy to eat way too much.
  • Chicken and salad are not always the best choices. You should read the Nutrition Facts before choosing your meal. Frying chicken results in triple the fat content when compared to chicken that is roasted. And big packets of high-fat dressing or cheese really ratchet up the fat on a salad, too.
  • The onion rings contain the same amount of fat as the French fries. We are scared to admit that that surprised us in a good way. We thought it would be more.

_FHC2393-2


  • But the fast food onion rings, to our taste, are not as delicious as the ones you buy in the freezer section of the grocery store. We do bake those from time to time and use them to garnish a home cooked meal. But we only eat a few, like 3-4 at that meal.
  • An onion ring investigation revealed that the frozen onion rings from the grocery store (Ore Ida) contain half the calories and fat as the same size portion of onion rings from Burger King. The really great thing about making onion rings at home is that you commit to the portion and bake them for 20 minutes. Seconds would take too long to cook again!
  • A large order of fries will fill an entire dinner plate:

_FHC2385

  • It takes about 5-9 minutes to order and pick up your meal from a fast food restaurant if you are not in rush hour or at a really busy place.
  • You will bring over 1,500 calories and 75 grams of fat into your car if you order the large fries, the large double burger, and the large sweetened iced tea.
  • Those calories would take 10 hours of vacuuming to burn off. Or about 2 hours and 20 minutes of running, which, for most people, is the equivalent of running a half marathon. The trouble is, after consuming that much fat, you probably wouldn’t even want to walk around the block!
  • The items in this single meal would fill 2 dinner plates and 4 water glasses. Would you really serve that much food at home to one person?
  • You can make better choices if you “know before you go.” One great thing about the drive through, is that you can order sensibly before you are hit with the aroma of French fries!

So, without further ado, here is our Fat Poster masterpiece:

fat


Next week, we will publish the story about the sugar poster. But you don’t have to wait to preorder them.

Buy both posters together today!

candyfat


Sodium Math: What We Learned

Sodium Math PosterHave you seen the Sodium Math poster yet? We released it shortly after the Dietary Guidelines for Americans debuted earlier this year. It’s a fantastic resource for displays, presentations, and even simple office decoration. With engaging questions and alluring graphics, this poster teaches valuable lessons about salt in a memorable way.

Of course, putting it together was no mean feat.

Today I want to walk through the process of creating this poster — I figured it would be useful for your own designs and displays. There were even 3 top lessons that we learned as we put the poster together! Plus, sodium is one of those food elements that most people don’t know enough about.

You see, once the latest edition of the Dietary Guidelines for Americans was officially released, I just knew that we had to create some kind of visual guide to dealing with sodium. But what? And how?

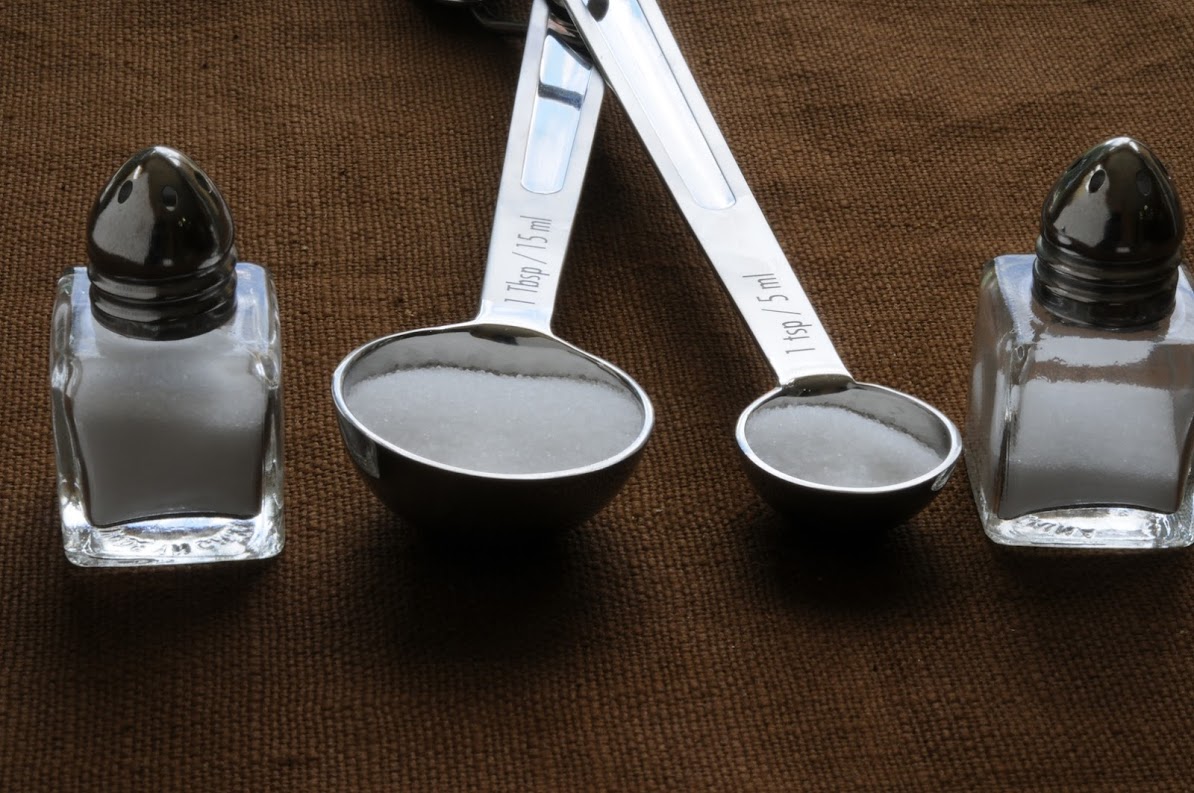
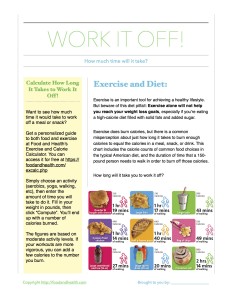
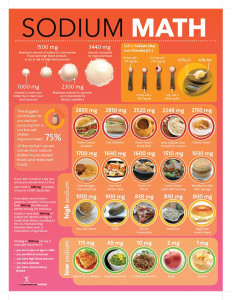
There’s always a lot of confusion about where sodium comes from in our daily diets. People hear the word “sodium” and they automatically equate that with “salt shaker.” However, the salt shaker is only responsible for a tiny amount of the sodium that most people consume each day. Most of the sodium (about 75%) comes from what is present in restaurant meals and packaged meals from the grocery store.

The Sodium Math poster is an engaging visual that shows how much sodium we are actually consuming versus how much is the maximum for good health.

SALTIt’s a bit of a shock to see the big pile of sodium that we eat each day and to see the teaspoons of sodium that each food contains! To balance that shock, the poster also showcases many fresh foods that are low in sodium. The poster clearly illustrates the lesson that a little work to eat 1,000 mg less sodium per day can make a big change in blood pressure.

This infogram poster was fun to work on and we learned a lot. Here are the top 3 lessons we learned in the making of this poster…

Lesson #1: True Sodium Content

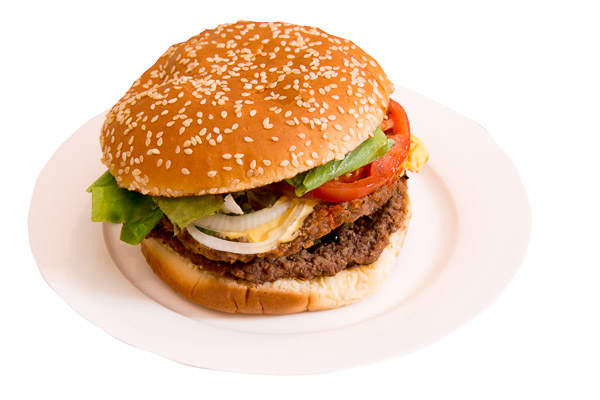
One of the biggest shocks to us in the research was about how much sodium is in fast food. Turkey sandwiches sound healthy, but a turkey deli sandwich has 2,810 mg of sodium. That’s almost a 2 day supply!

Lesson #2: Planned Overs

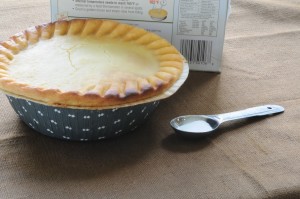
After reading this poster, we devoted more effort to making “planned overs.” (That’s when we cook extra food for dinner and eat it for lunch the next day). Cooking your own meals at home can make a huge difference in your health, especially when it comes to sodium.

Behind the Scenes: Sodium ContentLesson #3: Small Shifts Are Important

The Dietary Guidelines for Americans 2015 recommend that just a small shift to lower sodium intake by 1,000 mg per day can make a positive impact on lowering blood pressure. This lesson was new to us and it seems relatively easy to implement. Plus, everyone loves an easy math lesson! We chose math because we wanted a way to explain sodium, salt, sodium intake, recommended sodium intake and changes needed, along with engaging food photos that can illustrate the whole lesson quickly.

So there you have it! A little peek behind the curtain and 3 lessons we learned while creating the Sodium Math poster.

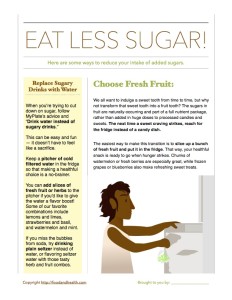
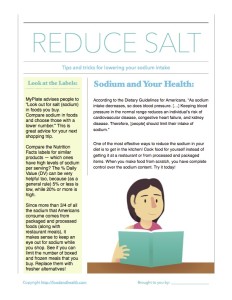
As a special bonus, here’s a copy of one of our top printable sodium handouts! Reduce Salt has lots of tips and tricks for lowering the sodium in your diet. Get your free copy today!

Sodium Reduction Handout

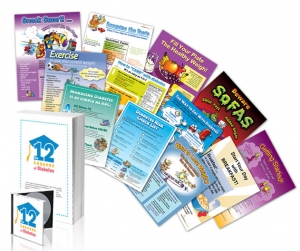
And there are lots of other amazing sodium resources in the Nutrition Education Store! Here are a few fan favorites…

Display of the Month: Sugar

Set Up Your Display!Let’s start a new tradition, shall we?

Today I want to usher in a brand-new series — the Nutrition Education Store Display of the Month! Each month, we’ll take a look at a new way to display the most important information about a key topic. And, we’ll do it in a way that will engage your clients and make your lessons memorable. What do you think? Are you intrigued?

For the first display, I want to focus on sugar. Here’s what I think will come together to make the best option…

The Materials:

The Activities:

  • Guess how many lollipops would go into a large soda from a fast food chain.
  • Discuss the impact of added sugars on health.

Let’s talk details!

Set up your display area with a table. For an extra aesthetic bonus, cover your table with a plain white tablecloth. Put any chairs you might need behind the table (this comes in handy if you’re manning a booth at a wellness fair — it’s less necessary for a single presentation). On the table, arrange the sugar test tubes wherever you see fit. Add a cardboard easel to hold up a poster for easy viewing, then place the Are You Drinking Candy? poster on top of that easel. Find a spot for the prizes you’ll be handing out — in this case bookmarks and stickers that encourage water consumption over sugary drinks. For the last part of the tablescape, grab a large empty cup from a fast food chain of your choosing and keep it within easy reach. You may also want to have a handful or two of small lollipops. Next to your table, place the Beverage banner on its stand in a place that’s easy for all your participants to see.

Once you’re all set up, you can proceed to the activities.

For the first activity, hold up the large soda container. Ask people to guess how many teaspoons of sugar go into a sugary drink that would fit in this container. Since most lollipops also contain a teaspoon of sugar, you can ask your participants to guess how many lollipops would equal the amount of sugar in one large soda instead. Poll the group, then reveal the answer: on average, a large soda from a fast food chain contains 51 grams of sugar. That’s 12 and 3/4 teaspoons of sugar! (Or, if you’re using lollipops, that’s 12 and 3/4’s lollipops worth of sugar). Hand out prizes to the people whose guesses were closest to that total.

For the second activity, it’s time to talk about the impact of added sugars on health. Introduce information from MyPlate and the Dietary Guidelines for Americans, explaining why moderation is so important when it comes to added sugars. It may also be useful to bring in some of these additional resources…

Additional Resources:

Here are a few blog posts with great handouts, charts, and information about sugar.

And there you have it! The first-ever display of the month! What do you think?

Oh, and here’s a closer look at a few of the resources we highlighted in today’s post. Remember, at the Nutrition Education Store, we’re here to help you look your very best, right now!

Sugar Test Tubes

Handout: Are You Drinking Candy?

Water Bookmarks

PS: Here’s a free PDF handout that you can also incorporate into your display!

Sugar Reduction Handout

Sneak Peek: Work It Off

It’s time for another sneak peek inside the Nutrition Education Store!

How Much to Work It Off?Today I want to talk about healthful eating habits. After all, there’s simply not enough time to work off a bad diet. That’s why Beth Rosen, MS, RD, CDN and I teamed up to create this wonderful new poster, Work It Off.

Work It Off outlines exactly how much time it would take a person to burn off the calories in common foods like burgers and soft drinks. Do your clients know that it would take 1 hour and 40 minutes to walk off the calories in half a frozen pizza? Or that an oversized cinnamon roll would take 2 hours and 14 minutes to walk off? Share all this painstakingly-researched information — and more! — with this fun and colorful poster.

Of course, the fun doesn’t stop there!

This poster comes with a free PDF handout. As a bonus just for you, I’d like to share that handout in its entirety, right now!

Here’s a preview…

Exercise is an important tool for achieving a healthy lifestyle. But beware of this diet pitfall: Exercise alone will not help you reach your weight loss goals, especially if you’re eating a high-calorie diet filled with solid fats and added sugar.

Exercise does burn calories, but there is a common misperception about just how long it takes to burn enough calories to equal the calories in a meal, snack, or drink. This chart includes the calorie counts of common food choices in the typical American diet, and the duration of time that a 150-pound person needs to walk in order to burn off those calories.

How long will it take you to work it off?

Get a personalized guide to both food and exercise at Food and Health’s Exercise and Calorie Calculator. You can access it for free at https://foodandhealth.com/excalc.php!

Simply choose an activity (aerobics, yoga, walking, etc), then enter the amount of time you will take to do it. Fill in your weight in pounds, then click “Compute”. You’ll end up with a number of calories burned.

The figures are based on moderate activity levels. If your workouts are more vigorous, you can add a few calories to the number you burn.

Like what you see? Get the handout for free!

Work It Off Handout

We’re here to help you look your very best, right now! Check out these marvelous nutrition education resources…

Choose Wisely Banner and Stand

12 Lessons of Diabetes Program

MyPlate Wall Cling for Kids