It’s time for an exclusive look at the handout that accompanies our awesome Nutrition from A to Z poster! How will you use your free copy?
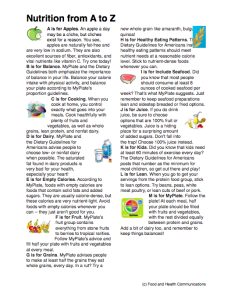
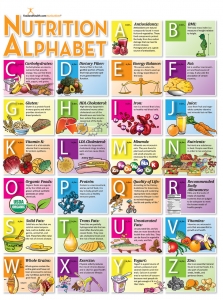 A is for Apples. An apple a day may be a cliche, but cliches exist for a reason. You see, apples are naturally fat-free and are very low in sodium. They are also excellent sources of fiber, antioxidants, and vital nutrients like vitamin C. Try one today!
B is for Balance. MyPlate and the Dietary Guidelines both emphasize the importance of balance in your life. Balance your calorie intake with physical activity, and balance your plate according to MyPlate’s proportion guidelines.
C is for Cooking. When you cook at home, you control exactly what goes into your meals. Cook healthfully with plenty of fruits and vegetables, as well as whole grains, lean protein, and nonfat dairy.
D is for Dairy. MyPlate and the Dietary Guidelines for Americans advise people to choose low- or nonfat dairy when possible. The saturated fat found in dairy products is very bad for your health, especially your heart!
E is for Empty Calories. According to MyPlate, foods with empty calories are foods that contain solid fats and added sugars. They are usually calorie-dense, but these calories are very nutrient-light. Avoid foods with empty calories whenever you can — they just aren’t good for you.
F is for Fruit. MyPlate’s fruit group contains everything from stone fruits to berries to tropical rarities. Follow MyPlate’s advice and fill half your plate with fruits and vegetables at every meal.
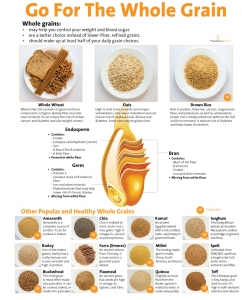
G is for Grains. MyPlate advises people to make at least half the grains they eat whole grains, every day. In a rut? Try a new whole grain like amaranth, bulgur, or quinoa!
H is for Healthy Eating Patterns. The Dietary Guidelines for Americans insist that healthy eating patterns should meet nutrient needs at a reasonable calorie level. Stick to nutrient-dense foods whenever you can.
I is for Include Seafood. Did you know that most people should consume at least 8 ounces of cooked seafood per week? That’s what MyPlate suggests. Just remember to keep seafood preparations lean and sidestep breaded or fried options.
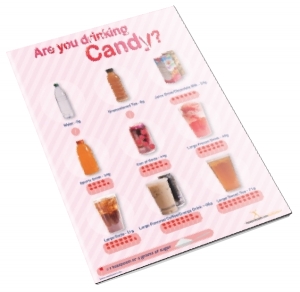
J is for Juice. If you do drink juice, be sure to choose options that are 100% fruit or vegetables. Juice is a hiding place for a surprising amount of added sugars. Don’t fall into the trap! Choose 100% juice instead.
K is for Kids. Did you know that kids need at least 60 minutes of exercise every day? The Dietary Guidelines for Americans posts that number as the minimum for most children, so get out there and play!
L is for Lean. When you go to get your servings from the protein food group, stick to lean options. Try beans, peas, white meat poultry, or lean cuts of beef or pork.
M is for MyPlate. Follow the plate! At each meal, half your plate should be filled with fruits and vegetables, with the rest divided equally between protein and grains. Add a bit of dairy too, and remember to keep things balanced!
N is for Nutrients. Most Americans aren’t getting enough nutrients. According to the Dietary Guidelines for Americans, people should replace foods that are made mostly of empty calories with nutrient-dense foods. Nutrients of concern in American diets include calcium, potassium, vitamin D and dietary fiber.
O is for Orange. Oranges are a nutrient powerhouse. They are full of vitamin C, antioxidants, and fiber. Eating oranges may also help lower your blood pressure and cholesterol. Try one today!
P is for Protein. MyPlate’s protein group is filled with meat, nuts, poultry, seeds, seafood, eggs, beans, and peas. Eat a wide variety of lean options daily.
Q is for Quality of Life. According to the Dietary Guidelines for Americans, “Achieving and sustaining appropriate body weight across the lifespan is vital to maintaining good health and quality of life” (2010, page 8).
R is for Reduced Risk. MyPlate claims that eating fruits and vegetables will reduce your risk of heart disease. That’s just one more reason to fill half your plate with fruits and veggies at each meal.
S is for Sodium. Most people are consuming way too much sodium. The Dietary Guidelines for Americans advise people to keep sodium consumption below 2300 mg per day. People who are African American, are over 51, or who have hypertension, diabetes, or kidney disease should all consume less than 1500 mg of sodium per day.
T is for Tomato. Tomatoes are filled with key nutrients to improve your health. They are excellent sources of vitamins A, C, and K, and also contain fiber and several B vitamins.
U is for Unique. Did you know that beans and peas are unique foods? MyPlate counts them as both a vegetable and a protein, so tally them where you need them the most!
V is for Variety. While portion sizes should stay small, it is important to eat a variety of fresh and healthful foods. Don’t fall into the rut of eating the same foods over and over — you could be missing out on nutrients! Look for new and nutritious foods to try each day.
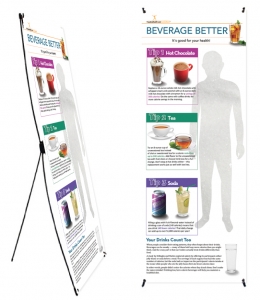
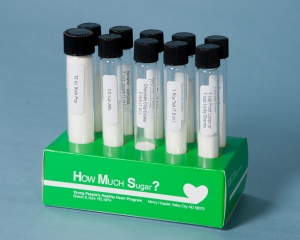
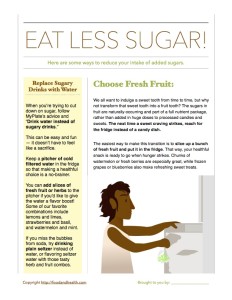
W is for Water. One of MyPlate’s key consumer messages is to replace sugary drinks like soda and sport beverages with water. Water is essential to health, and many people don’t drink enough of it.
X is for eXplanation. Do you want more details about healthful eating and balanced nutrition? Visit www.ChooseMyPlate.gov for more information about MyPlate. Or, drop by www.health.gov/dietaryguidelines for a closer look at the Dietary Guidelines for Americans.
Y is for Yogurt. Yogurt is a great source of calcium, but make sure that it doesn’t overload you with sugar and fat. Stick to low- or nonfat options, and check sugar content to make sure it isn’t too high.
Z is for Zone. Keep foods out of the danger zone. Food that has been sitting out at 40-140 degrees F for more than 2 hours is no longer safe to eat.
Like what you see? Here’s the free handout! Normally you can only get this when you get the Nutrition from A to Z poster, but we’re making an exception for you today!
But wait, there’s more! Check out these great nutrition education posters that will help you look your very best, right now!
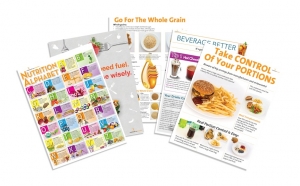
Nutrition Poster Set
Whole Grain Poster
12 Lessons of Wellness and Weight Control Posters