Sugar: Do the Math

Sugar can be confusing to your students or clients.

They hear lots of different numbers … percent of calories from sugar, teaspoons of sugar, and grams of sugar.

They see lots of terms … natural sugar, added sugar, and other names for sugar.

They’re bombarded with misinformation … “I can’t eat fruit because it has sugar!” “Honey is natural so it’s healthier than sugar.”

Clear up the sugar confusion once and for all with our Sugar Math PowerPoint show that comes with speaker’s notes, handouts, and clipart.

Your audience will learn how to do the math when it comes to sugar:

  • How to calculate sugar limits by calorie intake
  • How to find added sugars on the Nutrition Facts panel
  • How to translate grams of sugar to teaspoons of sugar
  • How to tally up their daily sugar intake

And they’ll learn about:

  • Foods and beverages that are high in added sugars
  • How to spot hidden sugars
  • Simple swaps to lower sugar intake
  • Why cutting down on sugar is important to health

If you want to do it yourself, why not visit the Dietary Guidelines for Americans and show how the limit for refined sugar is 10% of calories per day?

Discussion points: what is refined sugar, and what is 10% of calories per day for most people? Look at a few popular food labels and discuss how these foods can fit. Ask the audience what they would do on 10% calorie budget for their sugar intake. Do beverages make sense?

By Hollis Bass, MEd, RD, LD

PDF Handout: Sugar Math

Don’t Forget About Water!

During the winter, it’s easy to forget to drink enough water.

Our Drink Water poster is a great reminder that, while you may not be hot and thirsty like you are in the summer, the body still needs water. This poster catches people’s attention with interesting graphics and easy-to-read tidbits of information.

Here are some discussion topics to go with the Drink Water poster:

  • Discuss the facts about water and hydration. For example, our poster points out that your body loses water through breathing, sweating, and digestion, and that your body is about 60% water.
  • Brainstorm strategies to drink more water throughout the day. Special water bottles, flavored water, and taking a drink whenever you pass a water fountain are just a few ideas.
  • Review other sources of water, like unsweetened tea or coffee, skim milk, and even foods that contain lots of water (another reason to eat lots of fruits and vegetables!).
  • Explain how replacing sugary drinks with water helps you cut calories. And even people who drink lots of diet soda might want to consider switching to water.

Raise a glass of water to toast good health!

Hollis Bass, MEd, RD, LD

Dietary Guidelines: Keep on Cutting Added Sugars

The Scientific Report of the 2020 Dietary Guidelines Advisory Committee was released last week. Among the recommendations is to limit intake of added sugars to 6% of daily calories. This is a decrease from the 10% recommended in the 2015 Dietary Guidelines for Americans.

Considering that an estimated 63 percent of Americans aren’t meeting the 10% goal, we have our work cut out for us! Sugar sweetened beverages are a good place to start.

The Scientific Report says that about 1/3 to 1/2 of the added sugars we consume comes from sugary drinks. Here’s a look at the percent of added sugar intake from beverages (not including milk or 100% fruits juice) for different population groups:

  • Young children: 32 percent
  • Adolescents: 49 percent
  • Adults (age 20-64): 58 percent
    • Pregnant women: 48 percent
    • Lactating women: 31 percent
  • Older adults (age 65+): 35 percent

We have lots of materials to help you teach about added sugars, sugary drinks, and better beverage choices, including:

  • Are You Drinking Candy materials — to show just how much sugar is in common drinks like soda, sweet tea, and sports drinks.
  • Sugar Math PowerPoint show — to teach clients and students how to get from “10% or 6% of daily calories” to the grams of sugar shown on the Nutrition Facts panel.
  • Food Label materials — to find grams of added sugar on the Nutrition Facts panel and make sense of the % Daily Value.

Here are five points to share about cutting down on sugar sweetened beverages:

  1. Break down the 6% recommendation so folks can understand it. Using a 2000 calorie diet as an example, you’re looking at 30 grams of added sugar, which is equal to 7.5 teaspoons of sugar.
  2. Show them where to find added sugars on the food label. The number is given in grams and % Daily Value.
  3. Identify their sugary beverage of choice. The Advisory Committee found that these drinks provide the most added sugar to our diet: soft drinks, fruit drinks, sports and energy drinks, smoothies, coffee and tea with added sugar.
  4. Keep track of the sugary beverages you’re drinking, then make a plan to cut the number of ounces down gradually. Alternatively, some people might just want to make a clean break all at once.
  5. Brainstorm low- or no-sugar options to replace their favorite sugary drink.

Remember, the 6% added sugar recommendation is in the recently released Scientific Report, which was submitted to the U.S. Department of Agriculture and the U.S. Department of Health and Human Services last week. Now these two agencies will come up with the Dietary Guidelines for Americans — the recommendations on what the average American should eat and drink to promote health and prevent chronic disease.

We’ll see if the 6% added sugar limit makes it into the 2020 Dietary Guidelines that will be published by the end of the year.


Stick to the Message on Added Sugar

As we await the release of the 2020-2025 Dietary Guidelines, this is a good time to review key parts of the 2015 guidelines that aren’t likely to change much. One of these topics is added sugar.

Specific sugar intake recommendations were included in the Dietary Guidelines for the first time in 2015 (whereas in years earlier they only recommended avoiding consuming too much sugar or moderate intake of sugar). The message: consume no more than 10% of daily calories from added sugar.

Sugar continues to be a hot issue. When the 2020 Dietary Guidelines Advisory Committee last met on March 12-13 (source), subcommittees presented their DRAFT conclusion statements. Here are a few related to added sugars:

  • Mean intakes of added sugar have significantly decreased over time, but remain high across age, sex, race-ethnic and income.
  • There is a notable increase in the intake of added sugars when 1-year-olds are compared with babies less than 12 months of age.
  • Nearly 70% of added sugars come from five food categories: sweetened beverages, desserts & sweet snacks, coffee & tea (with their additions), candy & sugars, and breakfast cereals & bars.
  • A large percentage of daily sugar intake comes from beverage consumption: 30% for young children, 50% for adolescents, and 60% for adults.
  • The top beverage sources of added sugars: regular soft drinks, fruit drinks, sports/energy drinks, smoothies, and coffee and tea with added sugars.

So what messages about sugar do we need to keep sharing?

  1. Clear up sugar confusion. Consumers may not get it — ‘Doesn’t milk have sugar?! Fruit has sugar!’ But when it comes to sugar, ‘added’ is the key word. Don’t worry about the naturally occurring sugar in REAL food when there’s so much added sugar in PROCESSED food.
  2. The new Nutrition Facts label is key! We no longer have to arm our clients with long lists of ingredients that actually mean sugar. Added sugar is now on the label – we just need to remind folks to look for it. See our New Food Label materials for ideas on how to do this.
  3. To understand the food label, you have to understand Sugar Math. Teach clients and students how to get from “10% of daily calories” to the grams of sugar shown on the new Nutrition Facts panel.
  4. Beverages matter. Choosing water and sugar-free drinks can make a big difference in your sugar intake. We have lots of materials on this — a favorite being Are You Drinking Candy?
  5. Switch to fruit for dessert. This is a great way to satisfy a sweet tooth without a lot of sugar. We even have a Fruit Tooth Dessert Cookbook!
  6. Start early for a lifelong low sugar habit. We want to be raising sugar-free kids who eat real food. Parents, grandparents, and childcare providers need our help. Check out our 0 to 5 Baby and Toddler Nutrition PowerPoint show.
  7. There’s no room for added sugar with MyPlate! Use resources from ChooseMyPlate.gov or see all the materials we have.


8 Things We Learned About Sugar

Sugar Math PosterWhen the new Dietary Guidelines for Americans (DGA) released their recommendations about sugar intake, we thought they made a lot of sense. After all, the World Health Organization has been recommending a 10% calorie limit on added sugars for over a decade. The DGA committee now recognizes that sugar makes up about 30% of daily calories in our country, so changes are needed to cut down on sugary beverages, snacks, and desserts with added sugars. Treat foods and beverages are no longer treats but daily staples, which in turn is a significant cause of obesity when people are not getting enough physical activity and when high-sugar foods are replacing high-fiber foods that can help people feel more satiated.

Yet if you tell people to keep their sugar intake to 10% of their daily calories, this advice doesn’t necessarily have much real-world meaning.

People would have to do a bit of math to figure out how much sugar that that recommendation is allowing for each day. To calculate it, they would first need to land on a daily calorie intake. A 2,000-calorie-per-day eating pattern is pretty typical, so in our example let’s use that as a base number. 10% of 2,000 calories is 200 calories each day. There’s the maximum in an easier format to apply to day-to-day life.

Of course, some people prefer to calculate their sugar needs in grams. To do that, divide the daily total calories from sugar by 4 (calories per gram). For a 2,000-calorie diet, the max is 50 grams.

Just for kicks, let’s set that out in teaspoons too. There are 4 grams of sugar in a teaspoon. That means that the daily cap is set at roughly 12 teaspoons of added sugars per day.

I hope those mathematical measurements can help your clients apply the DGA’s sugar recommendations to their daily lives. You can find all these measurements in the Sugar Math poster, which is what started this entire mathematical exercise.

Of course, the importance of sugar math isn’t the only thing we learned as we were putting the poster together. Here are the top 8 lessons that really made us think as we created that resource…

  1. One 12-ounce soda can have about 40 grams of sugar. That’s almost a full day’s supply of added sugar. Kid-sized sodas at most fast food places are 12 ounces — the same amount as that can of soda!
  2. Regular and large sodas at fast food places are usually equivalent to 2 or more cans of soda.
  3. Sweetened iced tea contains a surprising amount of sugar, roughly 22 grams per cup. Most bottles contain a couple cups or more, which in turn makes it easy to consume a day’s supply of sugar in one bottle of iced tea.
  4. Sweet treats are not only high in sugar but they are also high in calories. The average large cookie contains over 400 calories and a day’s supply of added sugars.
  5. Coffee drinks, tea, sodas, snacks, sweetened yogurt, and dessert can easily supply three days or more’s worth of sugar. It all adds up.
  6. A surprise to our team was that a can of soda is equivalent to a serving of candy!
  7. 50 grams can add up quickly, but if we could get to dinner without putting sweetened beverages in our day, then we had a little of our sugar budget left over for a half cup of frozen yogurt. In a typical day, I used the rest of my budget on a cereal bar and jam for a sandwich. Overall, the guideline helped us lower our calories, especially in beverage calories.
  8. It’s a great idea to track what you eat and drink in a day so you can make better choices.

And there you have it! 8 things we learned while putting together the Sugar Math poster. I’m really proud of this poster — it’s a great resource for nutrition and health educators because it lays out key lessons about added sugars in a fun and memorable way.

Want to share these lessons with your clients? From our collection of free printable nutrition education materials comes a new PDF handout all about added sugars!

Free Added Sugars Handout

And here are some other fantastic sugar education resources, straight from the Nutrition Education Store!

Display of the Month: Sugar

Set Up Your Display!Let’s start a new tradition, shall we?

Today I want to usher in a brand-new series — the Nutrition Education Store Display of the Month! Each month, we’ll take a look at a new way to display the most important information about a key topic. And, we’ll do it in a way that will engage your clients and make your lessons memorable. What do you think? Are you intrigued?

For the first display, I want to focus on sugar. Here’s what I think will come together to make the best option…

The Materials:

The Activities:

  • Guess how many lollipops would go into a large soda from a fast food chain.
  • Discuss the impact of added sugars on health.

Let’s talk details!

Set up your display area with a table. For an extra aesthetic bonus, cover your table with a plain white tablecloth. Put any chairs you might need behind the table (this comes in handy if you’re manning a booth at a wellness fair — it’s less necessary for a single presentation). On the table, arrange the sugar test tubes wherever you see fit. Add a cardboard easel to hold up a poster for easy viewing, then place the Are You Drinking Candy? poster on top of that easel. Find a spot for the prizes you’ll be handing out — in this case bookmarks and stickers that encourage water consumption over sugary drinks. For the last part of the tablescape, grab a large empty cup from a fast food chain of your choosing and keep it within easy reach. You may also want to have a handful or two of small lollipops. Next to your table, place the Beverage banner on its stand in a place that’s easy for all your participants to see.

Once you’re all set up, you can proceed to the activities.

For the first activity, hold up the large soda container. Ask people to guess how many teaspoons of sugar go into a sugary drink that would fit in this container. Since most lollipops also contain a teaspoon of sugar, you can ask your participants to guess how many lollipops would equal the amount of sugar in one large soda instead. Poll the group, then reveal the answer: on average, a large soda from a fast food chain contains 51 grams of sugar. That’s 12 and 3/4 teaspoons of sugar! (Or, if you’re using lollipops, that’s 12 and 3/4’s lollipops worth of sugar). Hand out prizes to the people whose guesses were closest to that total.

For the second activity, it’s time to talk about the impact of added sugars on health. Introduce information from MyPlate and the Dietary Guidelines for Americans, explaining why moderation is so important when it comes to added sugars. It may also be useful to bring in some of these additional resources…

Additional Resources:

Here are a few blog posts with great handouts, charts, and information about sugar.

And there you have it! The first-ever display of the month! What do you think?

Oh, and here’s a closer look at a few of the resources we highlighted in today’s post. Remember, at the Nutrition Education Store, we’re here to help you look your very best, right now!

Sugar Test Tubes

Handout: Are You Drinking Candy?

Water Bookmarks

PS: Here’s a free PDF handout that you can also incorporate into your display!

Sugar Reduction Handout

Energy Drinks: Just the Facts

It seems like we’ll eat or drink anything that will increase our lagging energy levels. Put the phrase “boost your energy” on a food or beverage, and we think, “Hey, I need that!”

Marketed to improve energy, promote weight loss, increase stamina, and boost athletic performance/mental concentration, energy drink sales are expected to reach $52 billion by 2016. Energy drinks are most popular with teens and young adults — 30-50% of them frequently consume energy drinks.

What’s in Energy Drinks?

Energy drinks start off with a combination of sugar or sugar substitutes and caffeine. Then herbal extracts like ginseng, guarana, yohimbine, and ginko biloba are added. There also might be amino acids, taurine, L-carnitine, or B vitamins too.

Although the Food and Drug Administration (FDA) limits caffeine content in soft drinks, there is no regulation of energy drinks, which are classified as dietary supplements. Many energy drinks contain 70-80 milligrams (mg) of caffeine per 8 ounces, which is three times the amount of caffeine in cola drinks. Since many energy drinks are packaged in containers that hold 12 ounces or more, the amount of caffeine can easily reach 200 mg or greater. 200-300 mg of caffeine per day is considered a safe amount for adults, and the American Academy of Pediatrics states that energy drinks are never appropriate for children and teens.

Manufacturers are not required to list the caffeine content from additives, which means that the actual caffeine content can exceed what is listed on the label – if it’s listed at all.

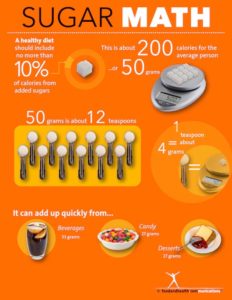
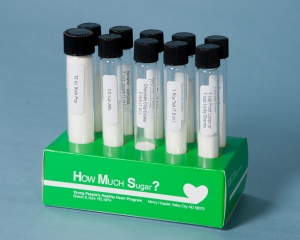
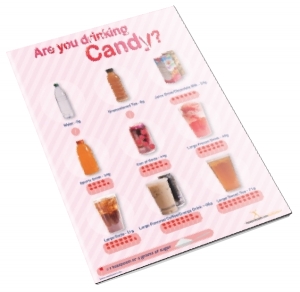
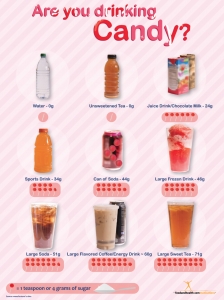
Plus, with 220-260 calories per 16-oz serving (that’s equal to 13-16 teaspoons of sugar), energy drinks also contain more sugar and calories than carbonated cola beverages. Sweetened beverages are a primary source of sugar in our diet, and they contribute to obesity and dental caries.

Should I Drink Energy Drinks?

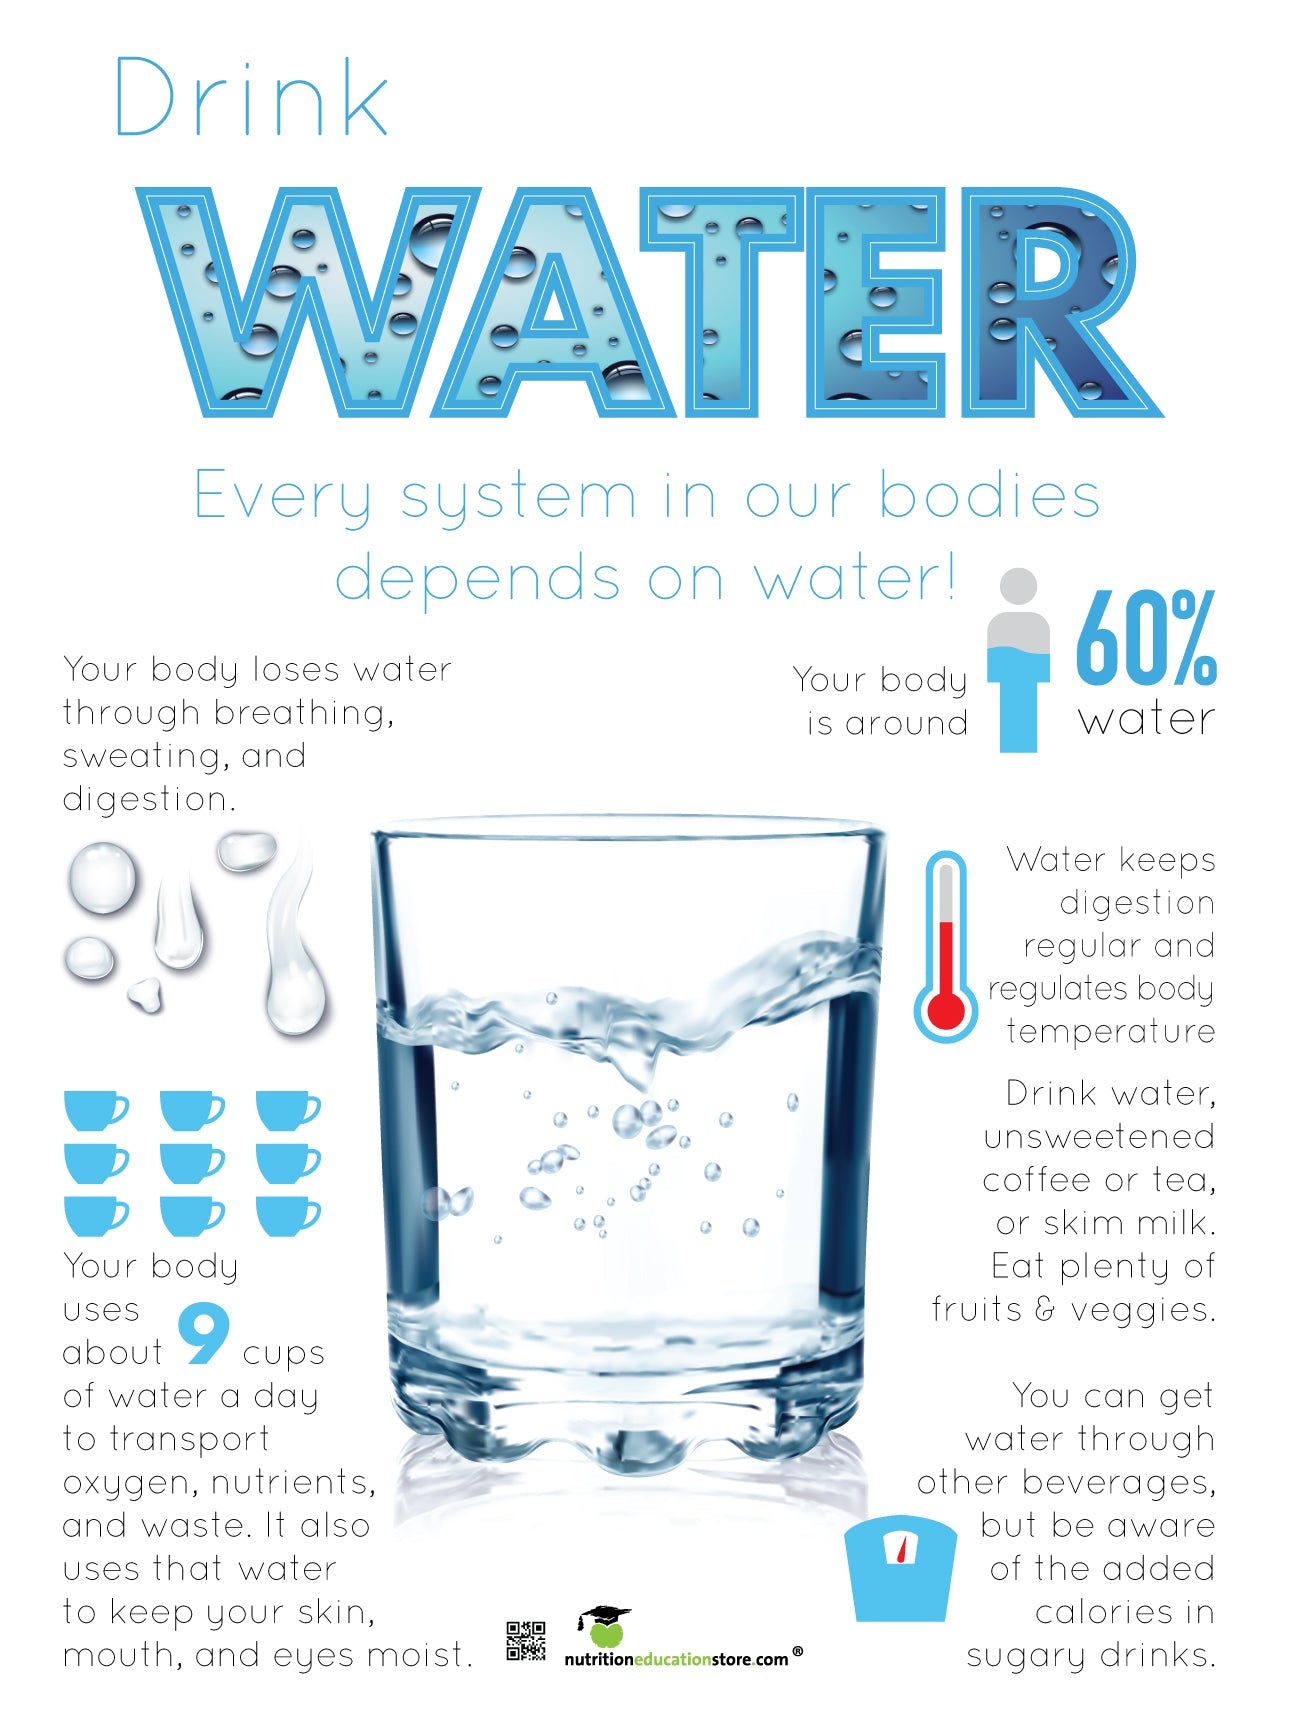
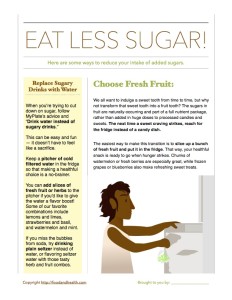
I recommend that you skip energy drinks and instead choose beverages that promote health and hydration. Think water, fat-free milk, and 100% fruit juice. For optimum energy, eat a balanced diet, get plenty of sleep, and participate in regular physical activity.

By Lynn Grieger RDN, CDE, CPT, CWC

References:

  1. The History of Energy Drinks: A Look Back. Wall Street Insanity. Samantha Lile. 5-6-2013. http://wallstreetinsanity.com/the-history-of-energy-drinks-a-look-back/ Accessed 5-21-14.
  2. Caffeine in the Diet. MedLine Plus. http://www.nlm.nih.gov/medlineplus/ency/article/002445.htm Updated 4-20-2013. Accessed 5-21-14.
  3. Proposed Actions for the US Food and Drug Administration to Implement to Minimize Adverse Effects Associated With Energy Drink Consumption. Thorlton J, Colby DA, Devine P. Am J Public Health. 2014 May 15.
  4. Sports & Energy Drinks: Answers for Fitness Professionals. Jerry J. Mayo, Ph.D., R.D. and Len Kravitz, Ph.D. http://www.unm.edu/~lkravitz/Article%20folder/sportsdrinksUNM.html
  5. Health Effects of Energy Drinks on Children, Adolescents, and Young Adults. Seifert, Schaechter, Hershorin, Lipshultz. Pediatrics. Mar 2011; 127(3): 511–528.
  6. Clinical Report – Sports Drinks and Energy Drinks for Children and Adolescents: Are They Appropriate? Committee on Nutrition and the Council on Sports Medicine and Fitness. Pediatrics 2011 Jun;127(6):1182-9.
  7. Energy Drinks. The American Association of Poison Control Centers. http://www.aapcc.org/alerts/energy-drinks/ Accessed 5-21-14

Handout:

Here’s a link to the free handout. Download it anytime!

Energy Drinks

More Resources:

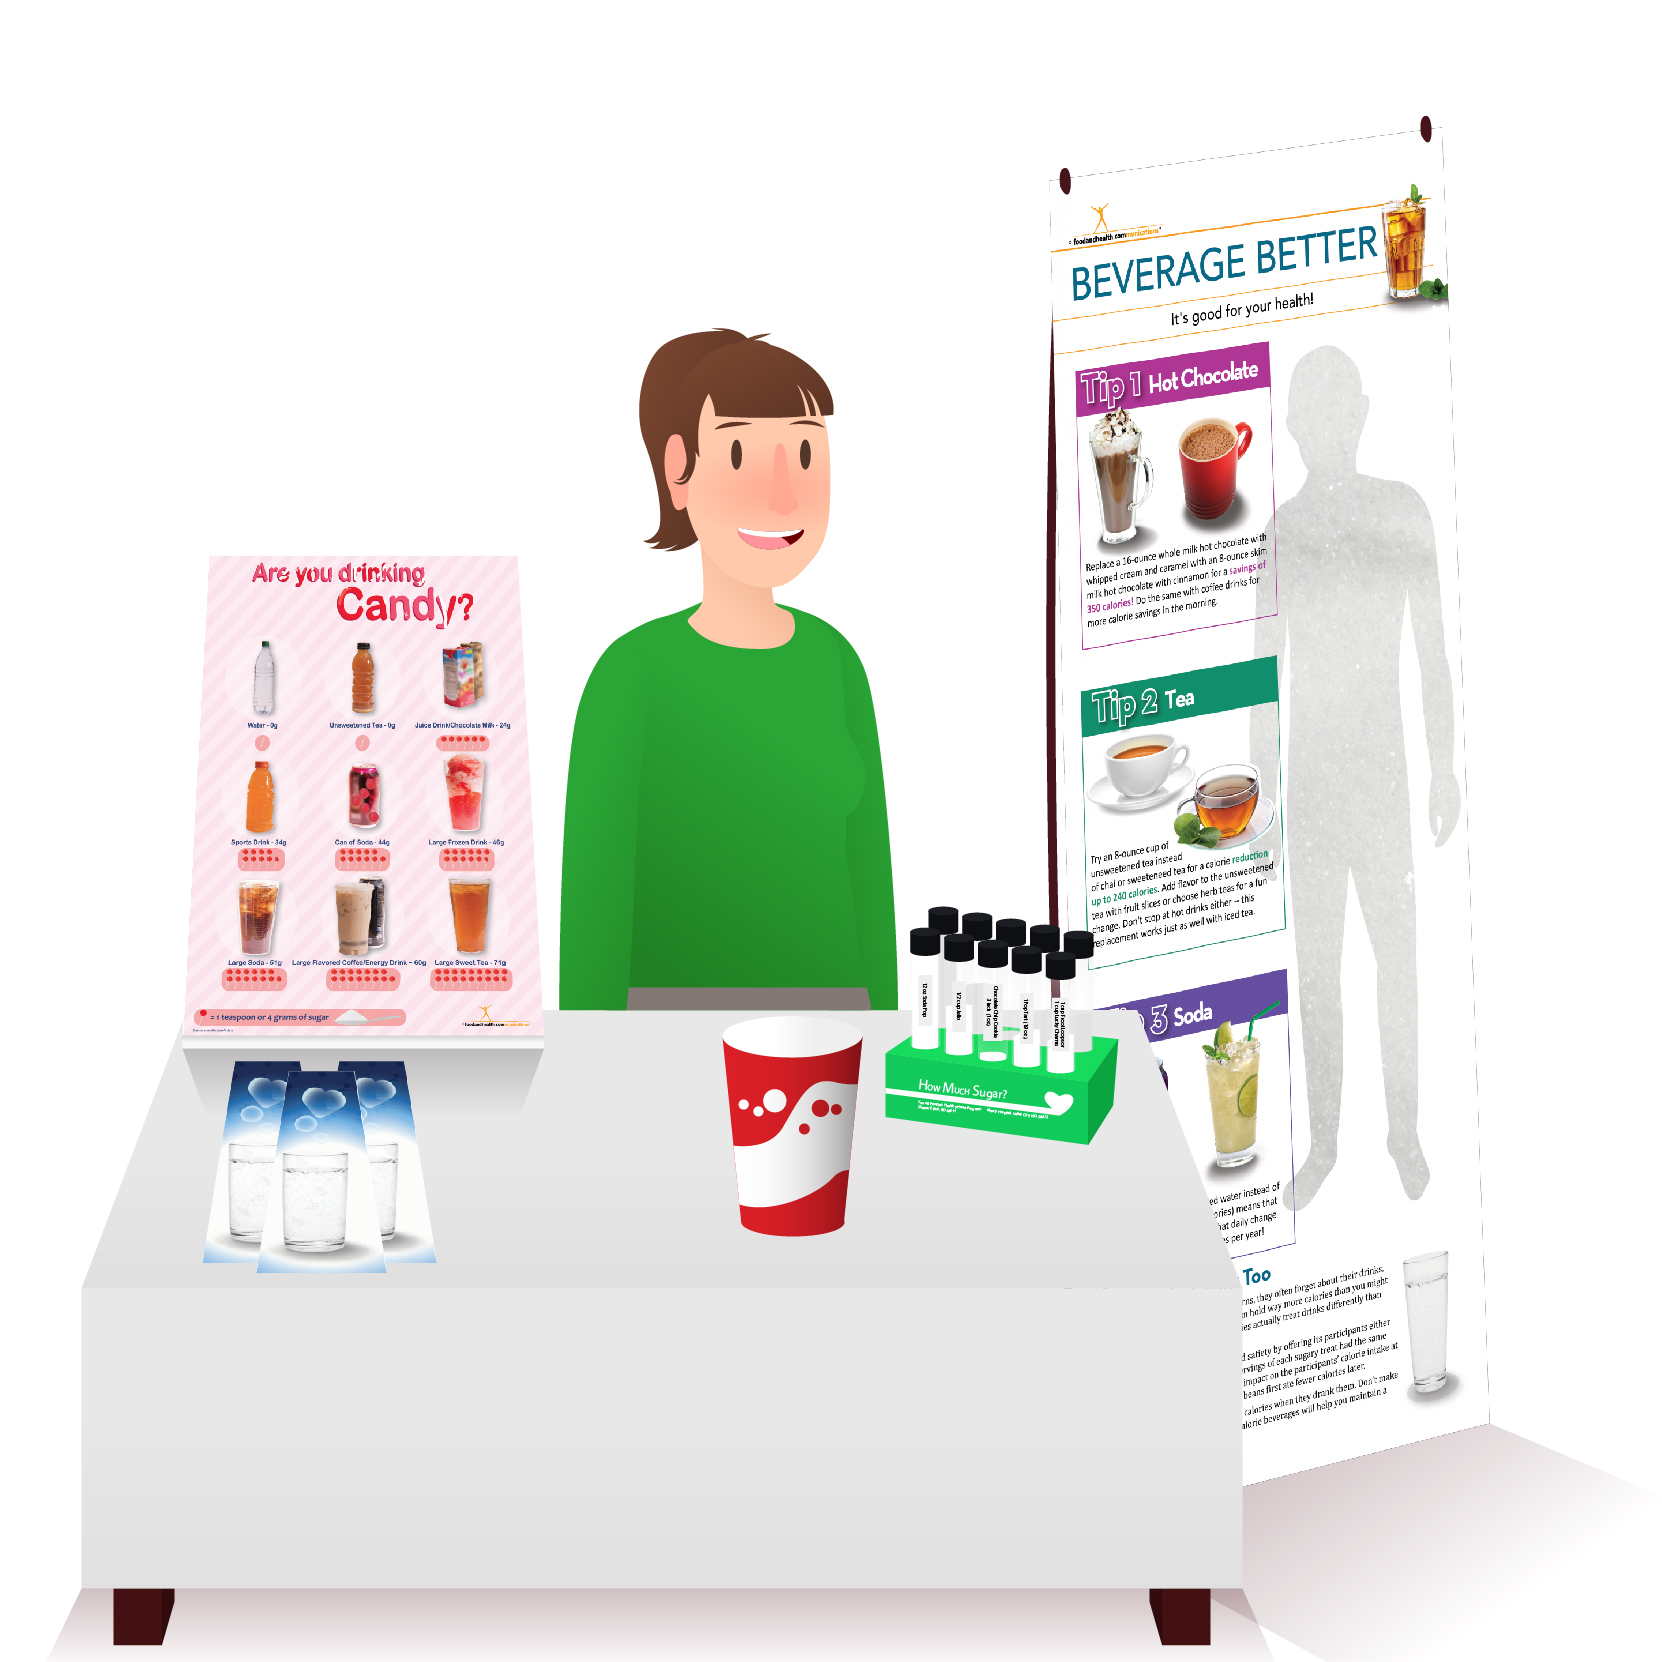
The Nutrition Education Store is always evolving. Check out the latest resources for beverages and health!

Sugar Awareness Handout

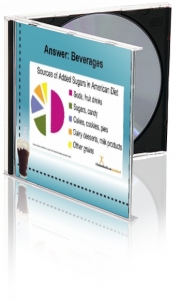
Don’t Drink Your Calories: PowerPoint and Handout Set
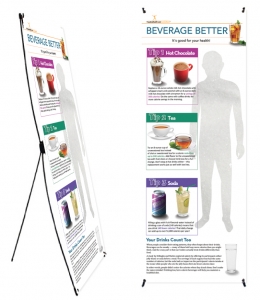


Nutrition Poster