Bulletin Board Idea for Spring

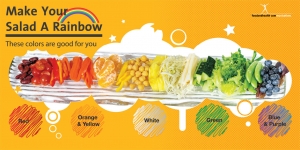
Spring is kicking into high gear, and what better time is there to put together a bright seasonal bulletin board with helpful health messages?

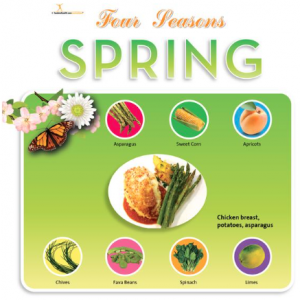
I created this Spring Bulletin Board Banner to highlight key foods that make their debut in the spring, and as I was looking at it the other day, I decided to outline how to use it to anchor a bulletin board display!

Here are the details…

Put the Spring Bulletin Board Banner in the upper right hand corner of your bulletin board area. Print out the recipe for the healthy spring dinner plate featured on the poster and arrange it next to your banner. Note that this recipe is only available to Food and Health members, so if you haven’t already signed up, take a look at the benefits of membership today!

If you have room for another handout, print out the free PDF that accompanies the Spring Bulletin Board Banner and arrange it on your board too.

Fill the remaining space with images of healthful spring produce. You can print these from the internet, cut them out of magazines, or draw them. You could also add some fun MyPlate stickers, which coordinate well with the color scheme featured on the banner.

What kinds of displays are you making for spring?

3 Activity Ideas to Make Every Bite Count

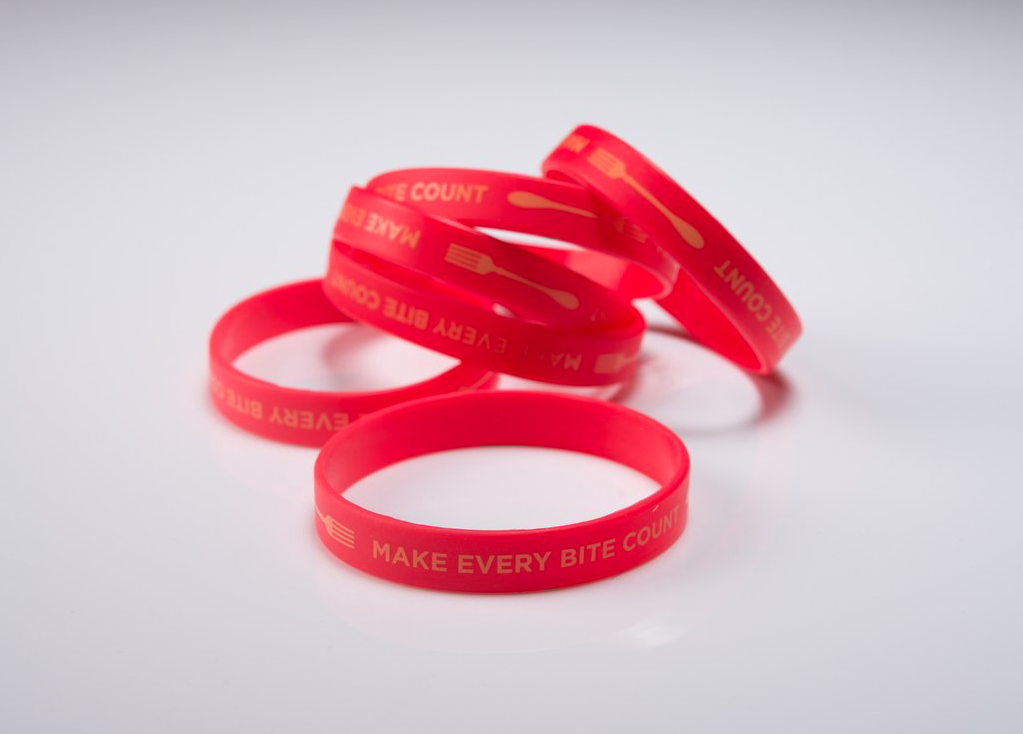
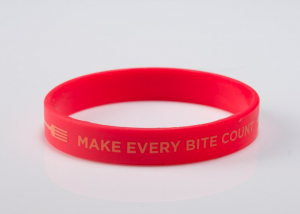
New wristbands have hit the store and I couldn’t be more thrilled.

Check out these great reminders to help your clients build a healthful eating pattern:


The thing I love about wristbands is that they are present every day. You can get the reminder whether your motivation is waxing or waning, and their placement on the wrist ensures that wristbands don’t get overlooked. The eye-catching color of these particular wristbands is an added bonus.

Today I want to celebrate the debut of these wristbands by featuring 3 activities that bring home the message that it’s important to make every bite count. These wristbands can be used as prizes for achievement and/or participation.

Activity #1: Word Cloud

Give each participant a blank sheet of paper and some colored pens or pencils. Have everyone write “Make Every Bite Count” in large letters in the middle of the page. Then, working individually, have each student write down words that can inspire them to make every bite count. Recommend varying the font size based on that idea’s importance to each student.

Once everyone has created their word clouds, reconvene the group and discuss what they wrote. You can either collect their papers and turn them into a display, or create a larger word cloud on a piece of posterboard with everyone’s suggestions.

Activity #2: Bite Buffet

Have each person bring in enough bite-size portions of their favorite healthful snack for each other member of the group to try. (Discuss food allergies and aversions before introducing this activity). As people snack, discuss what makes each food healthful. How does a single bite play into a larger eating pattern?

Activity #3: Bedazzle the Band

Distribute one Make Every Bite Count wristband to each person, along with a few colorful sharpies. Discuss the key topics addressed in this page, highlighting MyPlate’s encouragement to make small changes and remember that every food and drink you consume matters.

Have people decorate their wristbands with images of healthful foods and drinks or other reminders that every bite is important, keeping attention focused on the central premise highlighted on the band itself. This can be done in a group setting or individually at home.

And here are a few more wristbands for your perusal…

Display of the Month: MyPlate

It’s been a while since we’ve done a display of the month, and now is the perfect time to revive the tradition with MyPlate!

The Materials:

The Activities:

  • Food Group Lottery
  • Food Group Lighting Rounds

The Details:

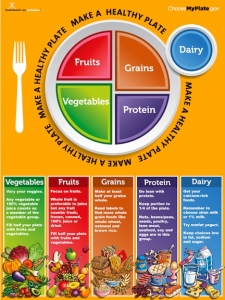
If you have access to the wall behind your table, set up either or both of the MyPlate Banners along with the Art of Health Poster. If you don’t have access to that wall, use just the MyPlate Banner and Stand alongside your table and add the Art of Health Poster to your table (you can prop it on a Tabletop Easel). In front of your table, arrange the MyPlate Floor Decal to add extra interest to your booth.

On the table itself, scatter the resources included in the MyPlate Wellness Fair Kit, leaving room for some MyPlate Handouts and the prizes (MyPlate StickersMyPlate Vegetable StickersMyPlate Fruit Stickers and/or MyPlate Bookmarks) you’re going to offer in order to draw people to your booth and reward participation during activities. In one corner of the booth, arrange the materials you’ll need for the food group lottery.

And, just for fun, finish setting up by tying on a MyPlate Apron, which you can later give away as a prize, if you’d like!

Now, on to the activities!

For the Food Group Lottery, have volunteers write down their names and favorite food groups on individual pieces of paper and put them all in a clear bowl or box. Shuffle all the submissions, then draw 10 winners. Reward them with the prizes listed above, or these adorable MyPlate buttons.

For the Food Group Lightning Rounds, gather all your participants in a circle in front of your booth. Explain that you’re going to name a food group and then each person has to list a healthful food that would fit in that group, one at a time. If a person can’t think of a food or lists something that isn’t healthful, he or she is out and the circle gets smaller. Repeat with the rest of the food groups until you’ve got a small group of winners remaining. All of the previously-suggested prizes would make great rewards, as would these pretty MyPlate plates!

Previous Display Inspiration:

Free Handout:

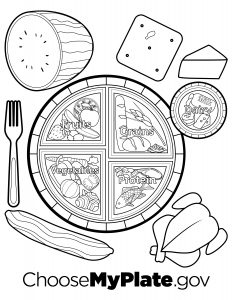
And, to add one more fun aspect to your display, here’s a free MyPlate coloring page. How will you incorporate this into your booth?

Finally, here are some fantastic workbooks to help your clients learn valuable health and nutrition lessons…

8 Things We Learned About Sugar

Sugar Math PosterWhen the new Dietary Guidelines for Americans (DGA) released their recommendations about sugar intake, we thought they made a lot of sense. After all, the World Health Organization has been recommending a 10% calorie limit on added sugars for over a decade. The DGA committee now recognizes that sugar makes up about 30% of daily calories in our country, so changes are needed to cut down on sugary beverages, snacks, and desserts with added sugars. Treat foods and beverages are no longer treats but daily staples, which in turn is a significant cause of obesity when people are not getting enough physical activity and when high-sugar foods are replacing high-fiber foods that can help people feel more satiated.

Yet if you tell people to keep their sugar intake to 10% of their daily calories, this advice doesn’t necessarily have much real-world meaning.

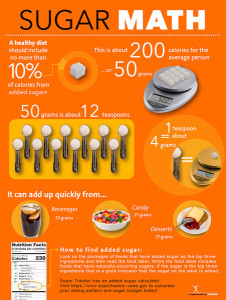
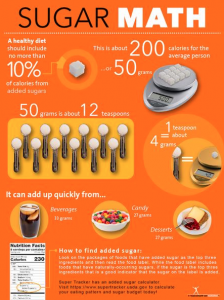
People would have to do a bit of math to figure out how much sugar that that recommendation is allowing for each day. To calculate it, they would first need to land on a daily calorie intake. A 2,000-calorie-per-day eating pattern is pretty typical, so in our example let’s use that as a base number. 10% of 2,000 calories is 200 calories each day. There’s the maximum in an easier format to apply to day-to-day life.

Of course, some people prefer to calculate their sugar needs in grams. To do that, divide the daily total calories from sugar by 4 (calories per gram). For a 2,000-calorie diet, the max is 50 grams.

Just for kicks, let’s set that out in teaspoons too. There are 4 grams of sugar in a teaspoon. That means that the daily cap is set at roughly 12 teaspoons of added sugars per day.

I hope those mathematical measurements can help your clients apply the DGA’s sugar recommendations to their daily lives. You can find all these measurements in the Sugar Math poster, which is what started this entire mathematical exercise.

Of course, the importance of sugar math isn’t the only thing we learned as we were putting the poster together. Here are the top 8 lessons that really made us think as we created that resource…

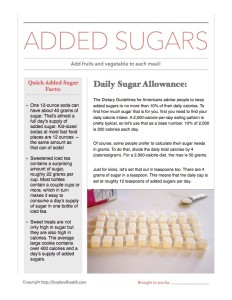
  1. One 12-ounce soda can have about 40 grams of sugar. That’s almost a full day’s supply of added sugar. Kid-sized sodas at most fast food places are 12 ounces — the same amount as that can of soda!
  2. Regular and large sodas at fast food places are usually equivalent to 2 or more cans of soda.
  3. Sweetened iced tea contains a surprising amount of sugar, roughly 22 grams per cup. Most bottles contain a couple cups or more, which in turn makes it easy to consume a day’s supply of sugar in one bottle of iced tea.
  4. Sweet treats are not only high in sugar but they are also high in calories. The average large cookie contains over 400 calories and a day’s supply of added sugars.
  5. Coffee drinks, tea, sodas, snacks, sweetened yogurt, and dessert can easily supply three days or more’s worth of sugar. It all adds up.
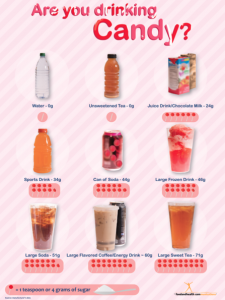
  6. A surprise to our team was that a can of soda is equivalent to a serving of candy!
  7. 50 grams can add up quickly, but if we could get to dinner without putting sweetened beverages in our day, then we had a little of our sugar budget left over for a half cup of frozen yogurt. In a typical day, I used the rest of my budget on a cereal bar and jam for a sandwich. Overall, the guideline helped us lower our calories, especially in beverage calories.
  8. It’s a great idea to track what you eat and drink in a day so you can make better choices.

And there you have it! 8 things we learned while putting together the Sugar Math poster. I’m really proud of this poster — it’s a great resource for nutrition and health educators because it lays out key lessons about added sugars in a fun and memorable way.

Want to share these lessons with your clients? From our collection of free printable nutrition education materials comes a new PDF handout all about added sugars!

Free Added Sugars Handout

And here are some other fantastic sugar education resources, straight from the Nutrition Education Store!

Sugar Math Misconceptions

Recently, a dietitian reader reached out to us with some old information about people’s recommended intake of added sugars. This interaction made me realize how much misinformation is still out there about sugar, so I want to set the record straight right now.

The Dietary Guidelines for Americans recommend that people “Consume less than 10 percent of calories per day from added sugars.”

That recommendation can be hard for people to apply in their daily lives if they struggle with calculating their total calorie intake and then what 10% of that number would be, so my team and I did a little math to  make the guidelines’ recommendation clearer to consumers.

Here’s what we did…

  • We found that the average daily calorie intake for most Americans is roughly 2,000 calories per day.
  • We calculated how many calories make up 10% of that daily intake.
  • We converted the number of calories to grams of added sugars so that people could easily calculate how much a food would impact this upper limit by using the Nutrition Facts label.
  • Just for fun, we also converted that amount to teaspoons of sugar. That way, people would have one more strategy for applying these numbers to their own lives.

All that math revealed that people should get no more than 200 calories per day from added sugars. That’s only 50 grams of added sugars per day! Since there are 4 grams of sugar in a teaspoon, that comes out to only 12.5 daily teaspoons.

We put all that information into our eye-catching Sugar Math poster and a tearpad to match. Take a look!

The information on which we based all these calculations has been supported by MyPlate, which is a publication of the U.S. Department of Agriculture, also known as the USDA.

And of course, the fun doesn’t stop there!

We then delved into the sources of added sugars in the American diet, figuring that knowing the top sources of hidden sugars in an eating pattern would be useful for consumers who are looking to follow the new sugar limits. We poured a lot of that knowledge into the Sugar Math poster and tearpad, along with the Are You Drinking Candy? poster and handout set. The lollipops in the latter really highlight how many added sugars are in a variety of common drinks. See for yourself!

Anyway, I just wanted to shine a light on some of the latest information about added sugars and empty calories. Misconceptions can lurk where you least expect them, but they sure are great teaching opportunities!

Oh, and here is a closer look at some sugar resources that my team and I have made…

Health News: Chronic Disease Risk Factors

A recent study published in the Journal of Clinical Endocrinology and Metabolism suggests that “metabolically healthy obese” people, a subset of obese individuals who were initially thought to not be at high risk of heart and other chronic diseases, still might have elevated health risks.

Study author Kristine Faerch from the Steno Diabetes Center in Copenhagen states that while it was once thought that it was not unhealthy to be overweight or obese if you lived a healthful lifestyle, newer research suggests that this is not the case.1 Overweight and obese individuals face an increased risk of type 2 diabetes and heart disease. To lower risk, maintaining a healthy weight throughout the lifecycle is vital.

Faerch and her team of researchers evaluated data from over 6,200 men and women that joined a Danish study wherein they were tracked for over 10 years. The subjects’ initial BMIs and risk factors for heart disease (including HDL a.k.a. “healthy” cholesterol levels, high blood pressure, triglycerides, and blood glucose) were all monitored. “Metabolically healthy” subjects had none of these risks, while “metabolically unhealthy” subjects were defined as having at least one risk factor. In the follow up period, 323 subjects developed heart disease. Men who were metabolically healthy but obese had 3 times the risk of heart disease when compared to metabolically healthy men at a normal weight. Women that were metabolically healthy but obese had double the risk of heart disease. Overweight men that were metabolically healthy had equivalent risk as their normal weight counterparts. Overweight women had a slightly higher risk than normal weight subjects. The authors note that only 3% of male and female subjects were obese, but considered metabolically healthy. Over a 5-year period, 40% of those considered metabolically healthy became metabolically unhealthy.

Joshua Bell from the UK’s University of Bristol was not surprised by these results. He and his colleagues published a paper this past February which noted that obesity increases age-related disability and decline, even in metabolically healthy individuals.2 His research found that after 2 decades, physical ability declined two times more while pain increased six times more in obese individuals when compared to normal weight individuals. Bell further stresses that heart disease is not the only risk factor to consider when discussing healthy aging.

Matthias Schulze at the German Institute of Human Nutrition in Potsdam-Rehbruecke believes that other measurements such as waist to hip ratios, waist circumference, and body fat could be explored to determine whether someone is “metabolically healthy” and obese.3 Healthy and obese can change to unhealthy and obese very quickly.

More research is needed to find how to decrease disease risk in both groups.

By Lisa Andrews, MED, RD, LD

References:

  1. Louise Hansen, MSc, Marie K Netterstrøm, MSc, Nanna B Johansen, MD, PhD, Pernille F Rønn, MSc, Dorte Vistisen, MSc, PhD, Lise LN Husemoen, MSc, PhD, Marit E Jørgensen, MD, PhD, Naja H Rod, MSc, PhD, DMSc, Kristine Færch, MSc, PhD. Metabolically healthy obesity and ischemic heart disease: a 10-year follow-up of the Inter99 study. J Clin Endocrinol Metab jc.2016-3346. Published March 7, 2017.
  2. J A Bell, S Sabia, A Singh-Manoux, M Hamer, and M Kivimäki. Healthy obesity and risk of accelerated functional decline and disability. International Journal of Obesity advance online publication 14 March 2017; doi: 10.1038/ijo.2017.51.
  3. Kristin Mühlenbruch, Tonia Ludwig, Charlotte Jeppesen, Hans-Georg Joost, Wolfgang Rathmann
    Christine Meisinger, Annette Peters, Heiner Boeing, Barbara Thorand, Matthias B. Schulze. Update of the German Diabetes Risk Score and external validation in the German MONICA/KORA study. Diabetes Research and Clinical Practice. June 2014 Volume 104, Issue 3, Pages 459–466.

And here are a few fantastic posters to promote healthy weight management…

Nutrition Month Activity Idea

Yes, I know that Nutrition Month is drawing to a close, but I couldn’t resist sharing one last activity idea to promote good health. Plus, this activity doesn’t have to be limited to March — use it anytime you want to teach a nutrition lesson!

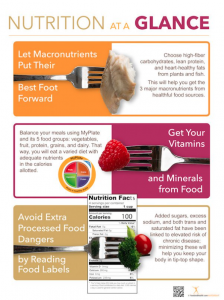
I planned this activity around the topics in the Nutrition at a Glance Poster so that you could help your audience internalize 3 keys to balanced nutrition. If you don’t have the poster, no sweat! Just address the topics with your class before you begin the activity.

Divide everyone into three groups and assign one of the three topics on the poster to each group:

  • Let Macronutrients Put Their Best Food Forward
  • Get Your Vitamins and Minerals from Food
  • Avoid Extra Processed Food Dangers by Reading Food Labels

Explain that each group is going to come up with 5 Jeopardy-style pairs of questions and answers about their assigned topic. If computers or smartphones are available, let the students use those to research fun facts and key points to address in their questions.

As the groups work, circulate around the room addressing any issues they might have and reviewing their question and answer pairs to make sure that they’re both accurate and answerable.

Once all the groups have their 5 questions, reconvene the class. Have the macronutrients group present their questions to the vitamins and minerals group, then have the vitamins and minerals group present their questions to the food label group. Finally, the food label group can present their questions to the macronutrients group. With this system, each group can engage deeply with 2 of the 3 topics on the poster.

As the teams are competing, keep score so that you can announce a winner at the end of the activity.

And what’s a good activity without a few prizes to motivate and reward your audience? Here are some of my favorites for Nutrition Month!

And for other great activities, don’t miss these fun posts…

Finally, what would Nutrition Month be without a little decoration? Check out these amazing materials…

Nutrition Presentation Introduction Ideas

We just heard a great new idea for nutrition presentation introductions! Diana Dyer, MS, RD, has developed a wonderful way to frame the idea of dieting. Check out the story, written in her own words…

The root of dietWhen I was on the speaking circuit, I always included a slide early in my talk that pre-empted — i.e. reframed — the word “diet” by showing people the root of the word. The root gives a much wider understanding of the original intent of the word, which is “a day’s journey.”

The way the word “diet” is used in our society today simply means disordered eating.

By contrast, the food I eat is one part of that day’s journey toward health, the ultimate goal. I learned to get that concept in early to give my audience time to reflect and then see the full day’s journey (as I talked about much more than food) and also to head off the very first question I used to get which was always “do you ever cheat on your diet?”

I then learned to talk about how the word “cheat” is not in my vocabulary and not on my radar screen. That’s because I choose to eat with intention, intentionally (i.e. thinking about) feeding either body or soul toward health.

Once that’s established, it’s all about portion size. After all, life without Thin Mints is not worth living. However, with my goal being overall health, I knew I could eat them (feeding my soul) but I also knew that I no longer needed to eat the entire box. Savoring 1 or 2 was plenty. Then I felt fine pitching the rest into my compost pile!

By Diana Dyer, MS, RD
Author: A Dietitian’s Cancer Story – www.dianadyer.com
The Dyer Family Organic Farm – www.dyerfamilyorganicfarm.com

Salad Bar Tabletop Sign

MyPlate Handout Tearpad

Change It Up Poster

Whole Grains for Health Gains

Look at any popular magazine these days and you’ll find at least one diet that bashes grains. Whether it’s Paleo, the Military diet, or the “whole 30”, someone, somewhere is out there trying to get you to eat a bun-less sandwich. But what they may not realize is that anti-carb diets are a thing of the past.

Grains are back, and for good reason.

A recent study from Tufts published in the American Journal of Clinical Nutrition found that subjects consuming whole grains over refined grains burned more calories and absorbed fewer calories overall. In addition, glucose tolerance was improved in whole grain consumers.1 Other studies have shown lower rates of obesity and cancer in individuals eating a diet containing whole grains.2

Susan Roberts, a professor of nutrition at Tufts and author of instinctdiet.com believes that Americans eat too many refined carbohydrates like white bread, pasta, pastries, and desserts, which contribute to overweight and obesity.3 Lauri Wright, an assistant professor in community and family health at the University of South Florida notes that whole grains are higher in antioxidants, which contribute to long-term good health.3

Rather than comparing weight changes in subjects, the Tufts study evaluated resting metabolic rate and energy (calorie) content in stool at the end of a 6-week study. Participants were, on average, 50+ years of age with a BMI of 25.6, which is slightly above normal but not overweight. Participants in both groups consumed about 2550 calories per day, but one group had 830 calories in whole grains while the other had 830 calories from refined grains. The study found that the whole grain eaters burned 40 calories more than their refined grain counterparts and lost ~50 calories in stool, resulting in a 92-calorie deficit. If this deficit is carried over for a year, a 5.5 lb weight loss could be achieved. 1 A previous 2011 Harvard study of over 12,000 subjects and whole grains supported these results. 2

Most Americans miss the mark on fiber intake, consuming a mere 15 grams per day. The subjects in the Tufts study that ate whole grains ate about 39 grams of fiber daily versus 21 grams in the refined carbohydrate group. 1 Researchers believe the feeling of fullness in whole grain consumers affects the brain’s ability to regulate metabolism. Because your brain does not perceive that you are conserving energy, metabolism is not reduced. This is good news for carb lovers.

Making the switch to whole grains can be easy. Swap brown rice or quinoa for white rice, or whole wheat pasta and bread for white bread or pasta. Try bran or wheat-based cereals in place of corn or rice.

Whole grains are the new black.

By Lisa Andrews, MED, RD, LD

References:

  1. Karl, J Philip, Meydani, Mohsen, Barnett, Junaidah, et. al., Substituting whole grains for refined grains in a 6-wk randomized trial favorably affects energy-balance metrics in healthy men and postmenopausal women. American J of Clinical Nutrition, February 8, 2017, doi: 10.3945/?ajcn.116.139683.
  2. Mozaffarian, D, MD, Dr PH, Hao, Tao MPH, Rimm, Eric B, Willett, Walter MD, Dr PH, Hu, Frank MD, PhD. Changes in Diet and Lifestyle and long term weight gain in men and women. N Engl J Med 2011; 364:2392-2404. June 23, 2011.
  3. Burfoot, Amby. Despite the anti-carb diet fads, whole grains are still good for you. The Washington Post: 20 March 2017.

Resources:

Help your audience get more whole grains each day with these accessible and memorable resources…

Nutrition Month Display Ideas

It’s not too late to set up an engaging display for National Nutrition Month!

The best displays feature information in a variety of formats, presented in an eye-catching and memorable manner. Here are a few strategies that you can use to put together your best display yet…
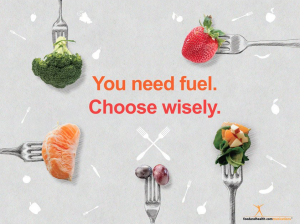
Bulletin Board:

It’s usually a good idea to center a bulletin board around a banner or poster. For Nutrition Month, I would recommend any of the following, depending on the space you have available.

Once you’ve picked a poster/banner or two to center your display, it’s just a matter of filling in the details. One way to vary the view while imparting key information is to add a few relevant handouts, like these!

You can also print out pictures that support your main point (people being active for an exercise board, healthful foods/meals for a nutrition board etc) and fill in a few gaps with assorted stickers or wall decals.

Tabletop Display:

Tabletop displays offer a better chance for interaction than a bulletin board display, but they also take up more room.

The key to a good tabletop display is having something that will draw people to the table. Banners on stands offer a great way to stand out from the crowd, and these options are perfect for Nutrition Month:

Floor stickers are also creative (and intriguing) eye-catchers here. My personal favorites include:

Then you want to fill your table with resources that will help your audience learn and remember key Nutrition Month lessons. Posters like the ones featured in the bulletin board section above are great options, and you can prop them up on a tabletop easel or two. Handouts are useful take-home resources too, as are stickers/bookmarks/other fun prizes.

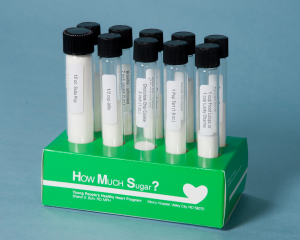
If you’re talking about sugar, salt, or fat content in your display, I’d highly recommend test tubes, which you can use to display the average amount of your featured element in a variety of foods.

These materials offer a great visual way to compare and contrast different options, and the test tubes have gotten wonderful feedback in the past. In fact, they’re one of our most popular resources for health fairs!

And there you have it! A little Nutrition Month display inspiration!

For additional resources to help with your National Nutrition Month celebrations, don’t miss these amazing materials…