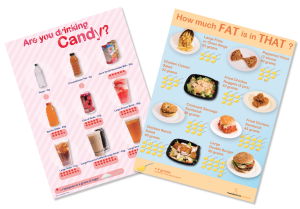
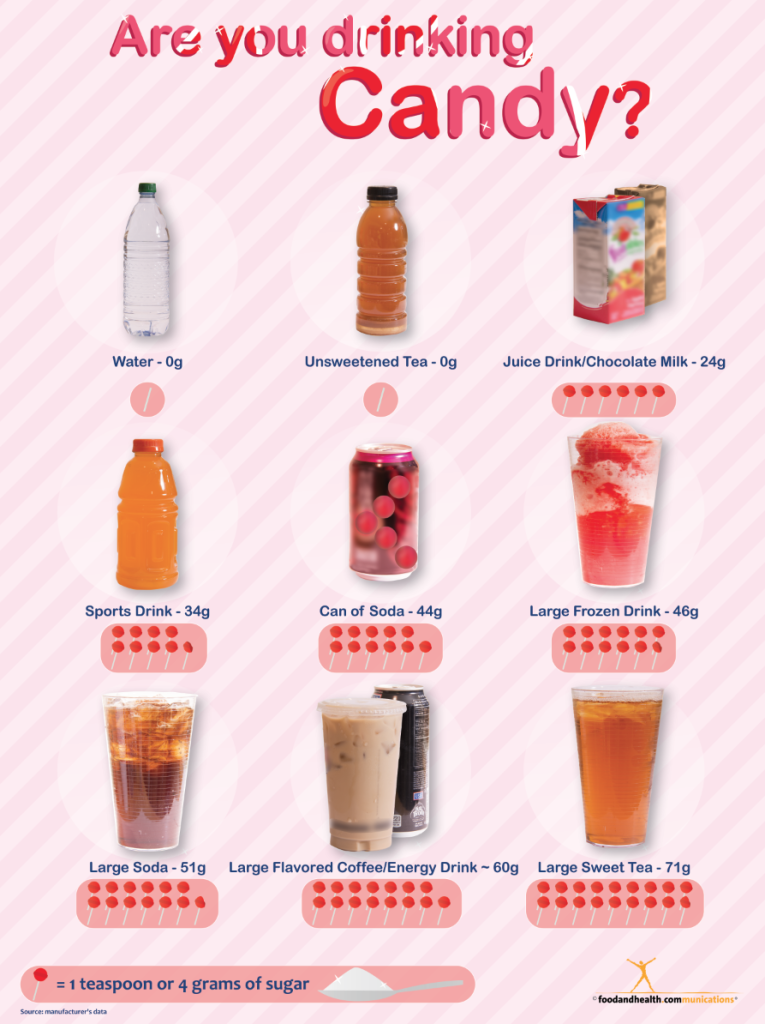
Are you drinking candy?
After getting numerous requests to publish a poster that shows the sugar content of beverages, we decided to oblige.
First we made a list of the most common beverages with added sugar that you can typically find in grocery stores, drug stores, convenience stores, and fast food restaurants. Then we started brainstorming ways to make a memorable infographic that would tell the whole story in just one glance. We learned many humorous lessons along the way. We’re also very proud of our pictures, thanks to a new camera. If you are a friend on Facebook, then you already know that we are smitten with pictures. (If you are not a friend yet, we promise that you will want to like our Facebook page to see all of the fun things we do all day)!
We found that several small lollipops contain 3.5 to 5 grams of sugar each. Suddenly, we had an illustration connection. One lollipop could represent 1 teaspoon of sugar! We felt that candy was more compelling than a plain image of a teaspoon of sugar. Isn’t it Mary Poppins that sings, “a spoonful of sugar makes the medicine go down, in the most delightful way?” And besides, our graphic artist loved making all of those lollipops… or so he told us.
Anyway, here’s what we learned while we made the poster…
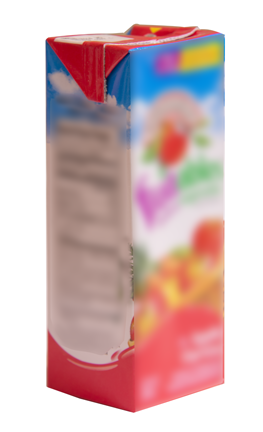
- The biggest shock to us was that the average juice box has the equivalent of 6 lollipops worth of sugar (though some contain as little as 4). Juice boxes are ubiquitous in the land of children. They get put into lunch boxes, after-game coolers, birthday and classroom party coolers, and home refrigerators. They freeze well and keep a lunchbox cool. They are handy because they don’t have to be refrigerated, and they even come with a free retractable straw. Plus, they don’t spill easily, they are easy to open, and easy to hold. Wow, we sound like a juice box commercial!And 100% juice is good for kids who won’t eat fruits or vegetables. However, chances are that most juice drinks served to kids are not always 100% juice. These boxes can be overused to the point that they displace the calories from real food, which contain more nutrients and fiber while making a balanced diet.
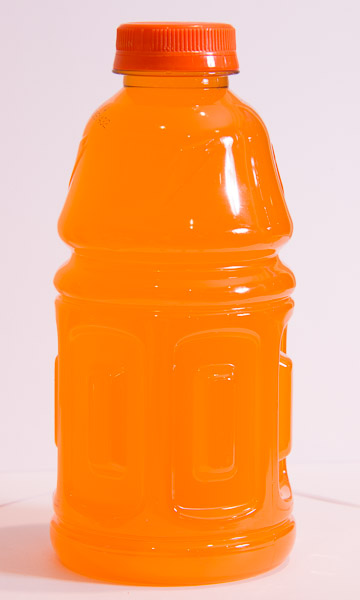
- Sports drinks contain almost as much sugar as a can of soda. Now, if you are doing Ironman training (where you swim, bike and run for hours and hours each day), the liquid calories are perfect because eating real food would cause digestive distress. But, for most people who struggle to put in enough time at the gym, these drinks are not necessary sport fuel. And we cringe when we think about all the overweight kids who sit on a soccer bench for an hour and then drink “sports drinks” and eat bags of pretzels before dinner. The colors of these drinks suer are beautiful, though. We had a hard time choosing a for the poster, but then we decided that orange was lovely with the pink background:
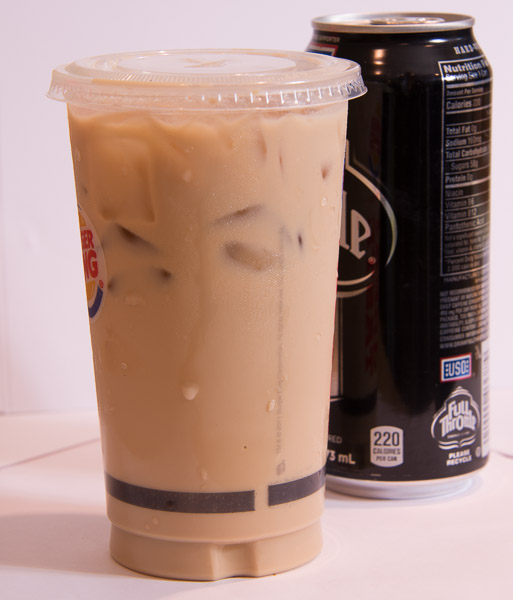
- Energy drinks and large flavored sweetened coffees are very similar in sugar content. We thought this was handy, since people drink them for the same reasons. Plus, they’re very photogenic together.The caffeine content in some energy drinks can be downright scary.
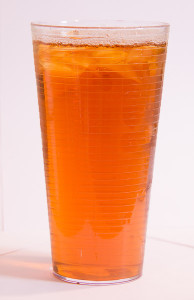
- Another surprise was that sweetened flavored tea could be a lot higher in sugar than the a soda of the same size. Who would have thought that a passion fruit iced tea would come in as the winner for our sugar show with 71 grams of sugar per 40 ounce cup?
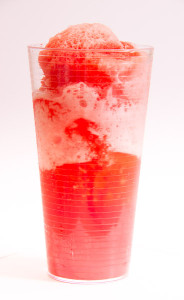
- Frozen sweetened drinks contain a surprising amount of sugar. There are even worse cases than the one we show on the new poster. You can go up to 85 grams of sugar in a large fruit smoothie. Large is the operative word, but it is not as large as you think! A 20 ounce cup filled with a frozen fruit smoothie can get you to 85 grams of sugar because syrup is added in the blender. We used a slush type of drink for the poster, because they are more common in convenience stores and it is mesmerizing to watch them go around and around and around and then come out of the machine in a swirl.
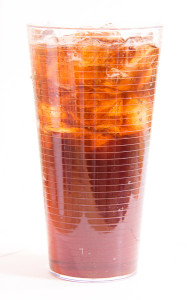
- But the biggest and greatest surprise of all was the SIZE of the large drinks: 40 ounces. I think we puzzled the man in the drive through when we ordered one of each of the largest drinks and we already had a full bag from a few other places. But 40 ounces is HUGE. I had to carry them to the studio one at a time so they wouldn’t spill along the way. And one of them filled 4 of my large water glasses, which is a great size recognition exercise all by itself. It was hard to find a clear glass that would hold all of it and still fit in the frame for the picture. One of these drinks contains 71 g of sugar, which is the equivalent of almost 18 small lollipops. I would not even eat that many lollipops between Halloween and spring break, but on a hot day this drink could go down fast.
- A 40-ounce soda contains almost 400 calories, which is practically a full meal. Of course, this “meal” isn’t balanced or healthful and there is no fiber whatsoever.
I can already picture the displays that you could make with this poster. You could put 18 lollipops in a jar and ask how many drinks they would make? (The answer is 1 — I bet no one would guess that all day). Or you could fill all sorts of cups and jars with the lollipops and make your participants guess which jar goes with matches which drink. There is a lollipop company on the internet who says they are combating obesity because one pop is a treat and it only contains 26 calories. I will leave the opinion on that theory up to you! I guess it is better than a big candy bar that has 500 calories. Maybe that is what they mean?
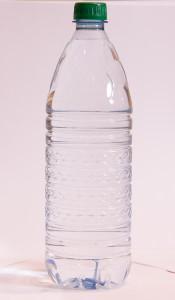
Making refrigerator tea at home is a great idea. It is fast, inexpensive, and tastes great! And of course water is always a great idea, too.
The CDC just published a new report in May 2013. This report shows that, for adults, one third of the calories they consume from added sugars (33%) came from beverages. In children and adolescents, 40% of calories from added sugars came from beverages. This is almost the same as a previous report from the Dietary Guidelines for Americans. That report showed that over half the amount of added sugar calories comes from beverages. Apparently the new finding is that foods eaten at home can add a lot of sugar to the diet. I am sure you will see this update in the 2015 Dietary Guidelines.
If you read the section about discretionary calories on www.choosemyplate.gov, the amount of discretionary calories for most adults is around 150. That is only 37 grams of sugar a day.
See the story about our fat poster here.
You can buy the fat and sugar poster together and save a great deal of money with our introductory offer: