Babies, Toddlers & Added Sugars

As we talked about in last week’s blog, the 2020 Dietary Guidelines Advisory Committee warns that Americans are consuming too much added sugar. The Committee’s new Scientific Report recommends that children under age two consume no added sugars at all.

Let’s take a closer look at the under 2 age group. Consider these points from the Scientific Report:

  • Intake of added sugars increases significantly between 12 and 24 months of age. (The trend continues through the preschool years, peaking during adolescence and young adulthood.)
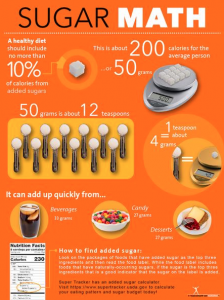
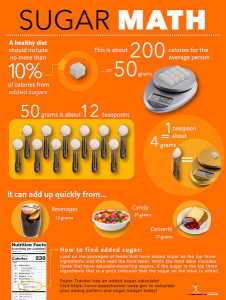
  • Toddlers age 12 to 24 months consume about six teaspoons of added sugars per day. That’s almost 10 percent of their recommended daily calories.
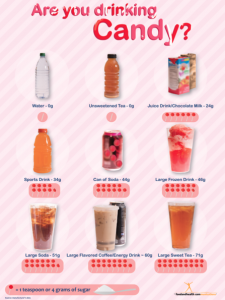
  • The main sources of added sugar are sweetened beverages (27 percent), sweet bakery products (15 percent), yogurt (7 percent), ready-to-eat cereals (6 percent), candy (6 percent), and other desserts (5 percent).

Once a baby turns one year old, they’re pretty much transitioning to the standard American diet. In fact, the Committee writes that “during this time between infancy and toddlerhood, large increases in added sugars and solid and saturated fats are observed.”

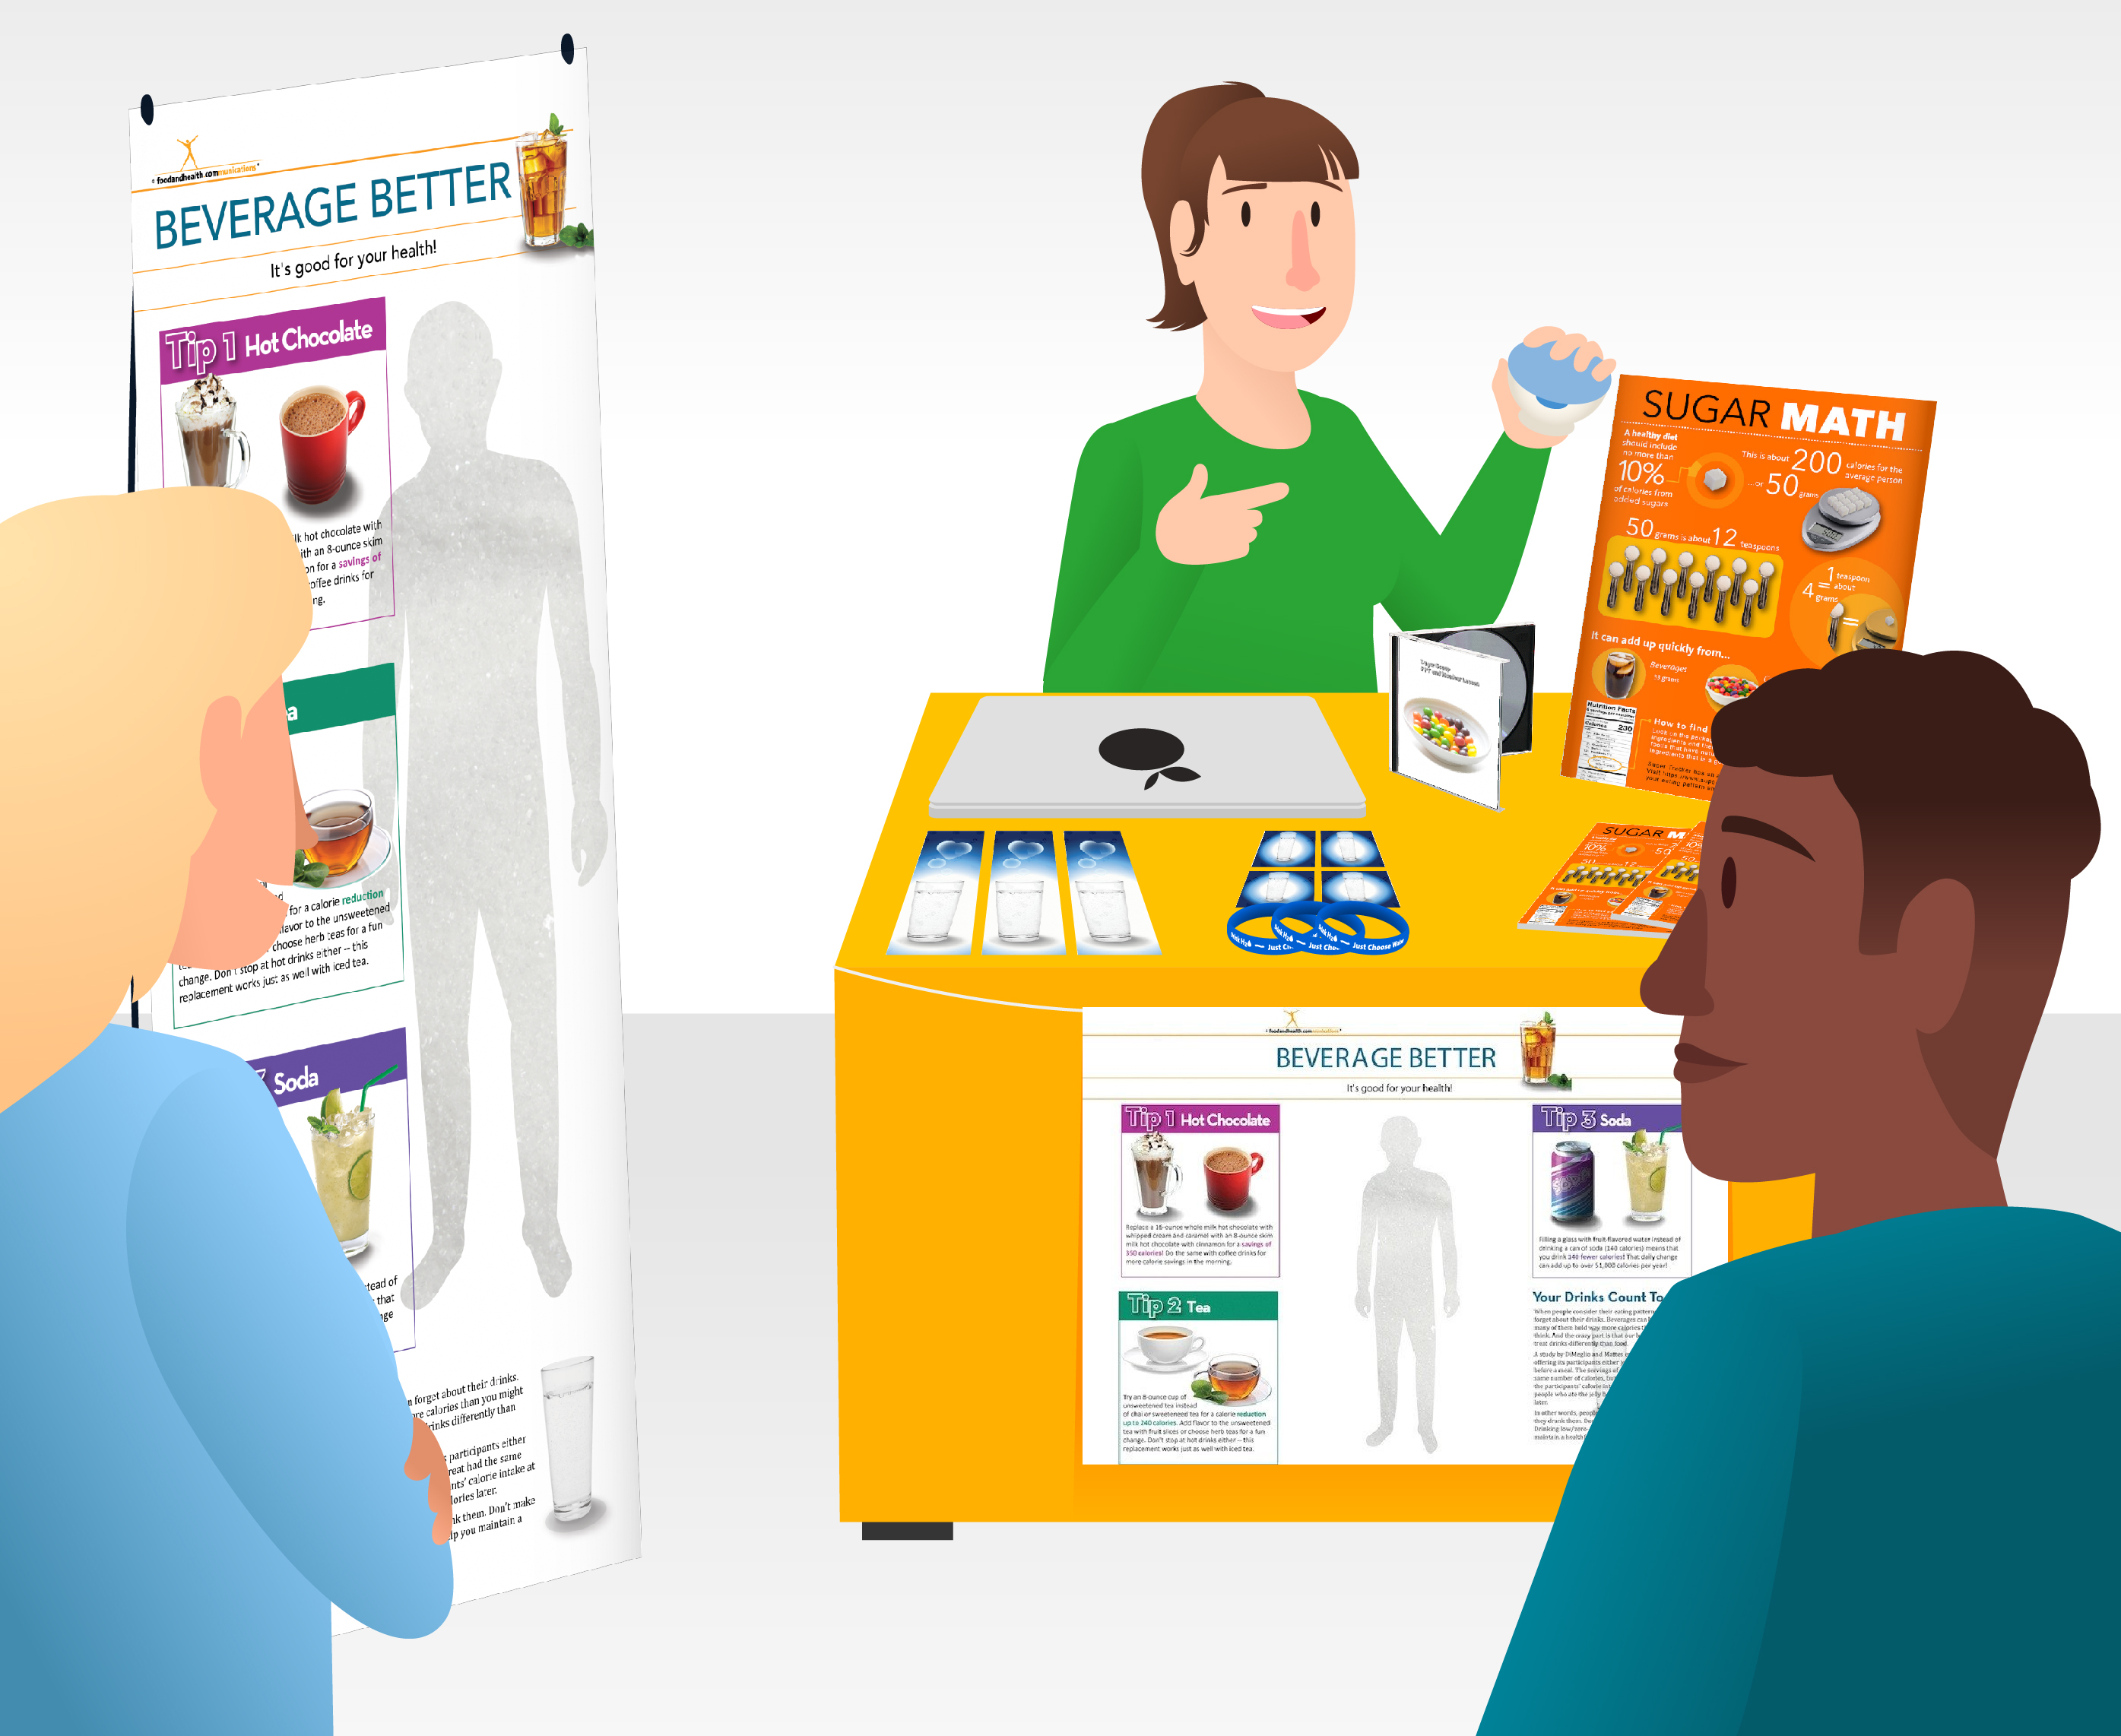
We need to get the no-sugar message to parents, grandparents, child care providers, and other caregivers. Important conversations to have:

  1. There’s no room in young children’s diets for sugary drinks and sweets. Those empty calories start a sugar habit that will last a lifetime.
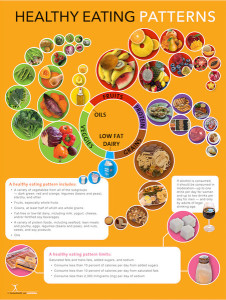
  2. Check the Nutrition Facts label for every food and drink you buy. The amount of added sugars is listed on the label.
  3. As adults, your intake of added sugars should be limited as well. This helps you stay healthy while limiting your children’s exposure to high sugar foods.
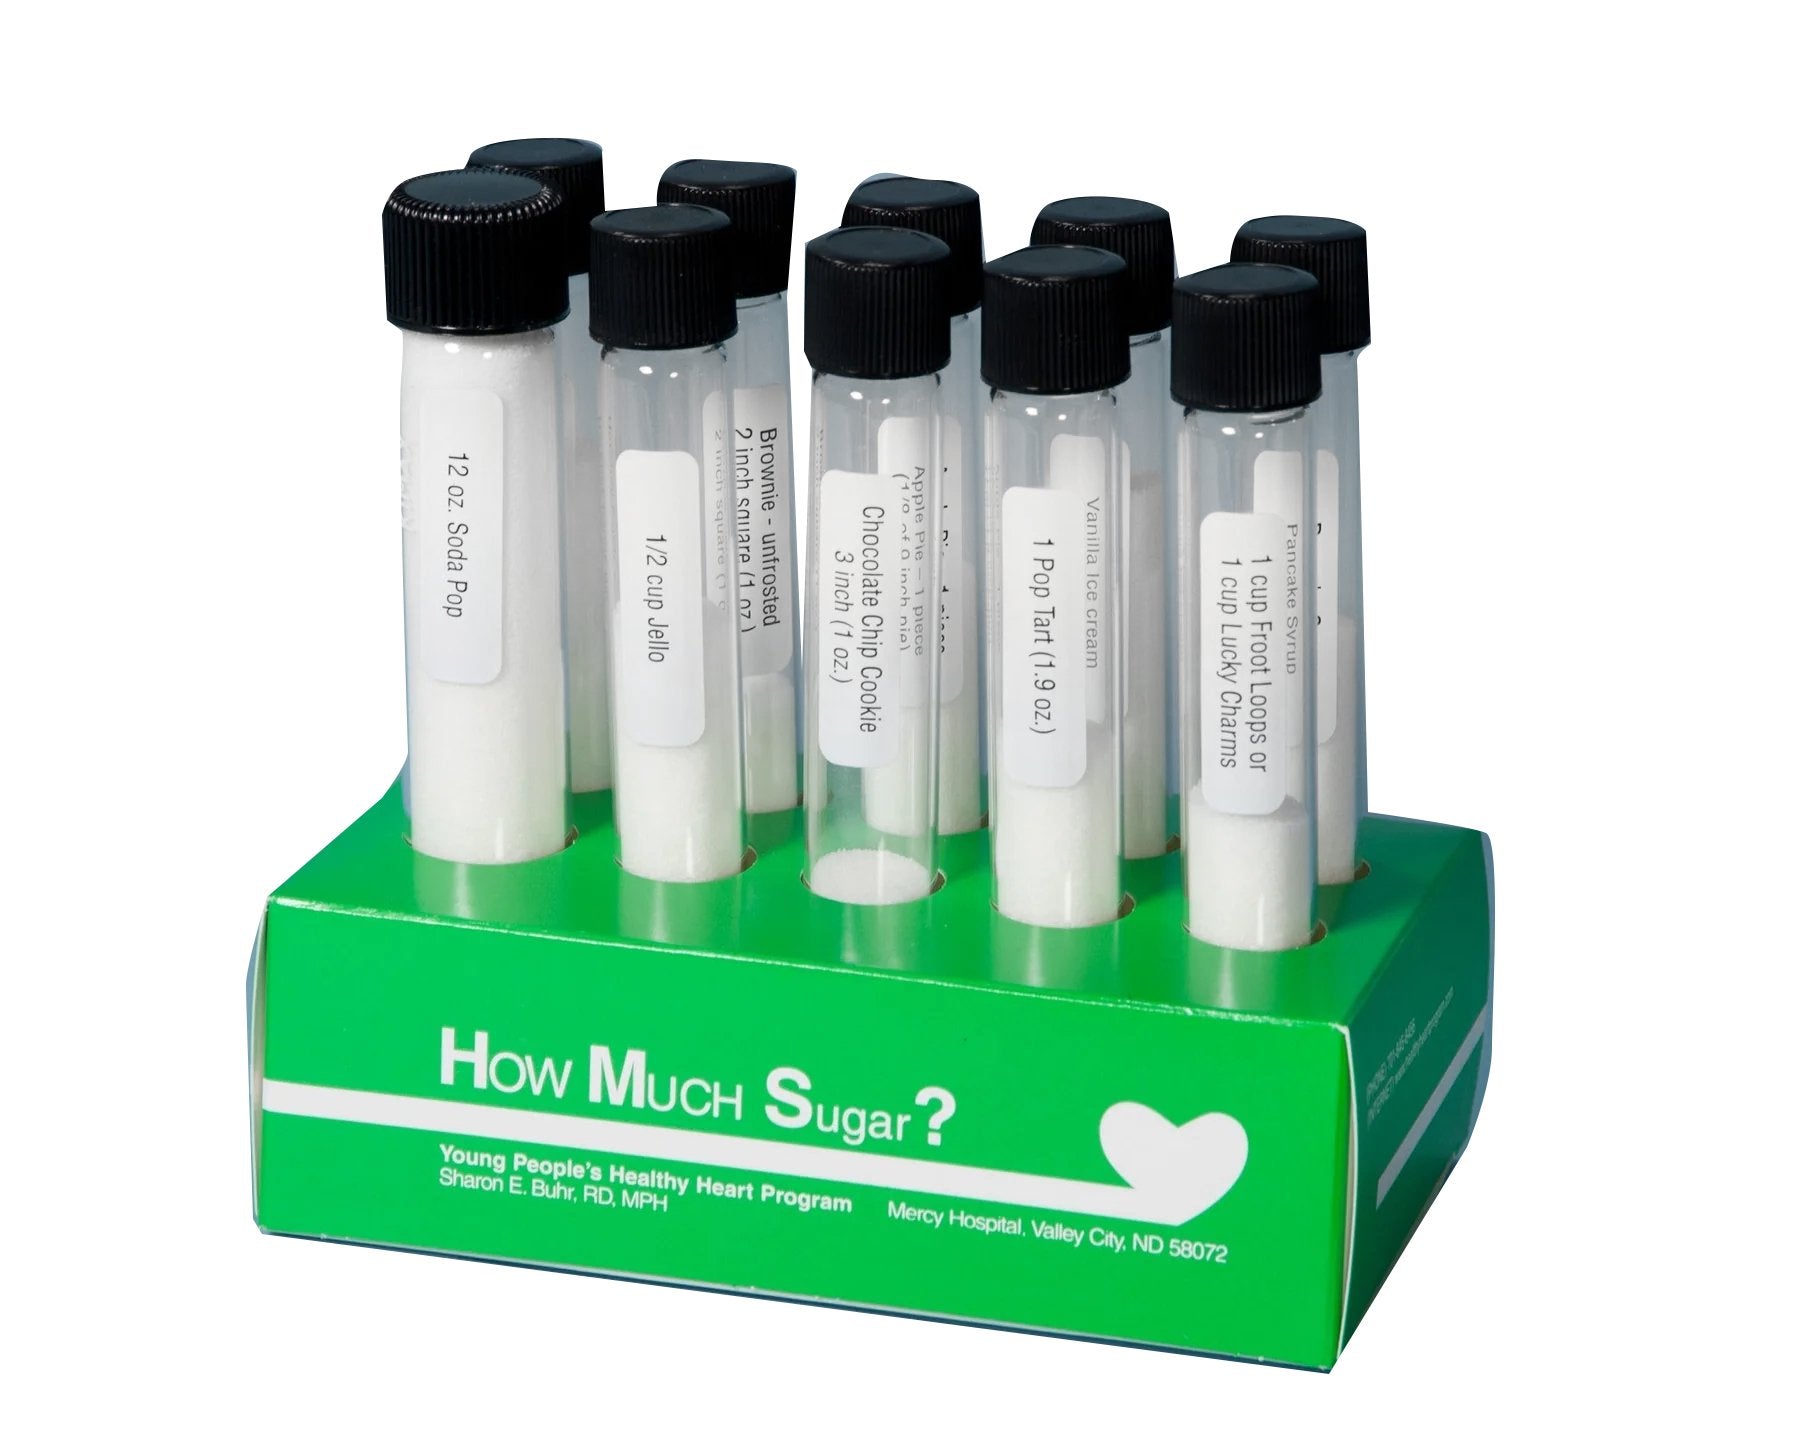
Remember, the 2020 Dietary Guidelines for Americans won’t be published until later this year. The recently released Scientific Report has been submitted to the U.S. Department of Agriculture and the U.S. Department of Health and Human Services. These agencies will review the report and develop the next version of the Dietary Guidelines for Americans.

Dietary Guidelines: Keep on Cutting Added Sugars

The Scientific Report of the 2020 Dietary Guidelines Advisory Committee was released last week. Among the recommendations is to limit intake of added sugars to 6% of daily calories. This is a decrease from the 10% recommended in the 2015 Dietary Guidelines for Americans.

Considering that an estimated 63 percent of Americans aren’t meeting the 10% goal, we have our work cut out for us! Sugar sweetened beverages are a good place to start.

The Scientific Report says that about 1/3 to 1/2 of the added sugars we consume comes from sugary drinks. Here’s a look at the percent of added sugar intake from beverages (not including milk or 100% fruits juice) for different population groups:

  • Young children: 32 percent
  • Adolescents: 49 percent
  • Adults (age 20-64): 58 percent
    • Pregnant women: 48 percent
    • Lactating women: 31 percent
  • Older adults (age 65+): 35 percent

We have lots of materials to help you teach about added sugars, sugary drinks, and better beverage choices, including:

  • Are You Drinking Candy materials — to show just how much sugar is in common drinks like soda, sweet tea, and sports drinks.
  • Sugar Math PowerPoint show — to teach clients and students how to get from “10% or 6% of daily calories” to the grams of sugar shown on the Nutrition Facts panel.
  • Food Label materials — to find grams of added sugar on the Nutrition Facts panel and make sense of the % Daily Value.

Here are five points to share about cutting down on sugar sweetened beverages:

  1. Break down the 6% recommendation so folks can understand it. Using a 2000 calorie diet as an example, you’re looking at 30 grams of added sugar, which is equal to 7.5 teaspoons of sugar.
  2. Show them where to find added sugars on the food label. The number is given in grams and % Daily Value.
  3. Identify their sugary beverage of choice. The Advisory Committee found that these drinks provide the most added sugar to our diet: soft drinks, fruit drinks, sports and energy drinks, smoothies, coffee and tea with added sugar.
  4. Keep track of the sugary beverages you’re drinking, then make a plan to cut the number of ounces down gradually. Alternatively, some people might just want to make a clean break all at once.
  5. Brainstorm low- or no-sugar options to replace their favorite sugary drink.

Remember, the 6% added sugar recommendation is in the recently released Scientific Report, which was submitted to the U.S. Department of Agriculture and the U.S. Department of Health and Human Services last week. Now these two agencies will come up with the Dietary Guidelines for Americans — the recommendations on what the average American should eat and drink to promote health and prevent chronic disease.

We’ll see if the 6% added sugar limit makes it into the 2020 Dietary Guidelines that will be published by the end of the year.


Displays for High School

It’s been a while since I shared a reader request in this space, so today let’s talk high school.

Sucu reached out to me recently, and here’s what she wanted to know…

Hello: Do you have any resources or suggestions for a nutrition message for a high school bulletin board you can share asap. Thanks.
Healthy Regards,
Sucu

What fun!

I initially pointed Sucu to a few things we’d already made. There’s a fantastic high school poster set in the store, and a whole 12 lessons for teens program that is chock-full of display ideas for a bulletin board. My team and I have been polishing a STEM (science, technology, engineering, and math) collection that could come in handy too.

But then I thought I’d get more specific.

So, here’s a how-to for two different bulletin board displays for high schools.

Display #1: Skip Sugary Drinks

Teens are drinking a lot of sugary drinks these days, and that can be bad news for their health, both in terms of displacing more nutritious calories and adding excess empty calories to their eating patterns. To help educate teens about what they’re drinking, start with a bright, eye-catching poster that can make up the center of your display. This Are You Drinking Candy? poster is a particularly compelling one, and Beverage Better and Sugar Math are two other good choices, so go with whatever best fits your aesthetic.

From there, take a look at the sodas, energy drinks, and sport beverages that are available at school. Take photos of the Nutrition Facts labels on each one if you can, or print off some labels for equivalent products and highlight the sugar content of each one, along with the serving size. Scatter these images around the poster. You could also measure out the equivalent amount of sugar into these great test tubes and attach the tubes to the board near photos of each drink and its Nutrition Facts.

Fill in the remaining space with more information about the impact of sugary drinks on health. This tearpad has great handouts, and this blog post about energy drinks comes with a free printable handout that would be a good fit for this theme too.

Take a look at our collection of prizes for other resources to make your bulletin board display as engaging and memorable as possible.

Display #2: Nutrition Facts Panel

The Nutrition Facts label is changing, and there’s no reason for teens to stay in the dark. To help them learn what they need to know to use this resource to improve their eating patterns, put together a Nutrition Facts bulletin board!

You can pull a lot of inspiration from the New Nutrition Facts Label Display post that we put together in the spring of 2016.

Combine this Nutrition Facts Poster with a Food Label Handout to center your bulletin board display. Or, if you have more space, this 48-inch by 36-inch Nutrition Label Vinyl Banner would be a great way to draw people over to your display. Add a few different Nutrition Facts labels to the bulletin board, highlighting elements that are either good or bad for the kids’ health (perhaps color-coding would come in handy). Highlight only one or two aspects of each label so that they don’t get overwhelming.

Finish off the board with a few Nutrition Facts Stickers and Nutrition Facts Bookmarks to fill any empty spaces.

I hope this comes in handy for you! Keep those requests coming!


Sugar Math Misconceptions

Recently, a dietitian reader reached out to us with some old information about people’s recommended intake of added sugars. This interaction made me realize how much misinformation is still out there about sugar, so I want to set the record straight right now.

The Dietary Guidelines for Americans recommend that people “Consume less than 10 percent of calories per day from added sugars.”

That recommendation can be hard for people to apply in their daily lives if they struggle with calculating their total calorie intake and then what 10% of that number would be, so my team and I did a little math to  make the guidelines’ recommendation clearer to consumers.

Here’s what we did…

  • We found that the average daily calorie intake for most Americans is roughly 2,000 calories per day.
  • We calculated how many calories make up 10% of that daily intake.
  • We converted the number of calories to grams of added sugars so that people could easily calculate how much a food would impact this upper limit by using the Nutrition Facts label.
  • Just for fun, we also converted that amount to teaspoons of sugar. That way, people would have one more strategy for applying these numbers to their own lives.

All that math revealed that people should get no more than 200 calories per day from added sugars. That’s only 50 grams of added sugars per day! Since there are 4 grams of sugar in a teaspoon, that comes out to only 12.5 daily teaspoons.

We put all that information into our eye-catching Sugar Math poster and a tearpad to match. Take a look!

The information on which we based all these calculations has been supported by MyPlate, which is a publication of the U.S. Department of Agriculture, also known as the USDA.

And of course, the fun doesn’t stop there!

We then delved into the sources of added sugars in the American diet, figuring that knowing the top sources of hidden sugars in an eating pattern would be useful for consumers who are looking to follow the new sugar limits. We poured a lot of that knowledge into the Sugar Math poster and tearpad, along with the Are You Drinking Candy? poster and handout set. The lollipops in the latter really highlight how many added sugars are in a variety of common drinks. See for yourself!

Anyway, I just wanted to shine a light on some of the latest information about added sugars and empty calories. Misconceptions can lurk where you least expect them, but they sure are great teaching opportunities!

Oh, and here is a closer look at some sugar resources that my team and I have made…

Display of the Month: Sugar Math

It’s time for a brand-new Display of the Month!

This month, I want to feature Sugar Math: an engaging and memorable way to teach valuable lessons about added sugars and good health.

Let’s dive right in!

The Materials:

The Activities:

August Sugar Math

The Details:

Set up your space as pictured above, adjusting your arrangements to fit the activities you’ve chosen and the space provided.

For the Sugar Quiz, pose the following questions to your group. You can divide them into teams and track points to declare a winner at the end or simply address volunteers individually. Don’t forget to offer Water WristbandsStickers, and Bookmarks as prizes for correct answers or for the winning team.

  1. True or false: A healthy diet should include no more than 10% of its calories from added sugars. (true)
  2. How many calories per day is the upper limit for added sugars for the average person? (200)
  3. And what is that in grams of sugar? (50)
  4. Where can you find added sugars? (on the new nutrition facts label, or point to the general list of sugars in a food and explore how to intuit how much of those sugars is added)
  5. Roughly how many teaspoons of sugar make up the average upper limit for daily added sugar intake? (12)

August Sugar Math Interactive

Now let’s talk about the Yogurt and Added Sugar Measurements Activity. You may need to rearrange your table for this one.

Gather your group around the table and hold up a clean, empty container that was once used to hold yogurt. Ask everyone how much sugar they think was in that container. Take guesses (if people are shy at first, use prizes like the Water WristbandsStickers, and Bookmarks as motivation for contributing), then show them where to find the answer on the label. Hold up a few more containers and repeat the process.

Pick a container of yogurt and have people use a teaspoon to measure out how much sugar is in that container (provide a dish of refined sugar and a few spoons for this purpose) assembling it all in a clear zip-top baggie. You can also use these amazing Sugar Test Tubes.

Do the same thing with the other containers of yogurt, discussing their findings as they go. How much sugar is in that yogurt? How much of it appears to be added sugar? Why?

If you have the resources, a Sugar Presentation is also a fun way to make lessons about added sugars more memorable. Cue up a projector (or your laptop) to show either the Added Sugars DVD or Sugar Scoop PowerPoint, or both! The PowerPoint comes with additional handouts, which you can distribute after the presentation.

Other Display Ideas:

Here is a collection of the past displays of the month. Which will make an appearance at your next health or wellness fair?

And here are some fantastic sugar resources, fresh from the Nutrition Education Store!

Nutrition Poster Guide

Today I want to try something a little different.

I’d like to offer a tour of a few lessons from some of the top posters in the Nutrition Education Store.

You see, 3 different posters have been extremely popular amongst health and nutrition educators recently, and now I want to draw them to your attention. After all, my job is to help you look your very best right now. So let’s take a look at the 3 top posters in the Nutrition Education Store.

Are you ready for this?

Sugar Math PosterPoster #1 is the new Sugar Math Poster. Its key lesson is to limit added sugars. 

How does it teach this lesson?

Through math problems!

You see, sometimes communicating important nutrition messages is a matter of breaking them down into manageable sections, making the information both accessible and memorable.

This poster manages that with varied representations of just how much added sugar people should limit themselves to each day.

Remember, the Dietary Guidelines for Americans advise people to “Shift to reduce added sugars consumption to less than 10 percent of calories per day.” That 10% is roughly 200 calories for the average person. That’s equal to 50 grams, which in turn is equal to about 12 teaspoons. The Sugar Math Poster features images of each of these amounts in an approach that’s bound to appeal to a wide range of learning styles.

The poster also highlights key sources of added sugars and spells out how to figure out how much added sugar is in a variety of packaged foods. No wonder it’s one of the most popular posters in the store!

Now let’s move on to the next poster.

Eating Patterns PosterPoster #2 is the Eating Patterns Poster from the 2015 Dietary Guidelines for Americans series. Its key lesson is to shift into a healthier eating pattern.

As you can see, this poster focuses on what is and is not included in a healthy eating pattern. With beautiful photos placed in a uniquely eye-catching arrangement, this post rocketed to the top of our list practically as soon as it was released.

So why represent healthy foods visually?

The photos demonstrate that healthy eating doesn’t have to be plain and boring. By making the foods that people need to consume look their very best, the photos in this poster add appeal to the eating pattern they’re illustrating. Plus, they provide a pop of color that would be welcome in any office, cafeteria, or display.

How would you use this poster in your life?

MyPlate PosterFinally, poster #3 is a classic — our very first MyPlate Poster. It teaches a fun way to balance your plate at each meal.

Ever since the USDA released MyPlate in 2011, it has been a popular tool to help educators teach their audiences about proper portions and proportions. As you know, My Plate offers a way to visualize a healthy and balanced plate at each meal, with half the plate filled with fruits and vegetables, grains taking up another quarter, and the remaining quarter of the plate filled with protein foods. A side of dairy rounds out the plate and completes the look.

Each food group has its own lessons and tips, and they all come together to create a healthy eating experience. This poster highlights the most important aspects of MyPlate, illustrating each food group and drawing attention to the key lessons associated with each section of the plate. Its as memorable as it is engaging, and the My Plate poster has been getting rave reviews since we first brought it to the store.

As an added bonus, I’d like to offer you an exclusive look at the handout that accompanies this MyPlate poster. Normally you could only get it if you bought the poster, but I want to make an exception today, so get your free copy of this handout now!

MyPlate Poster Handout

And finally, here are some more of the materials that are at the top of the Nutrition Education Store right now!

12 Lessons of Diabetes Kit

My Plate Handout Tearpad

Cooking Demonstration Kit: Set of 10 Cooking Demo Tools