Sugar: Do the Math

Sugar can be confusing to your students or clients.

They hear lots of different numbers … percent of calories from sugar, teaspoons of sugar, and grams of sugar.

They see lots of terms … natural sugar, added sugar, and other names for sugar.

They’re bombarded with misinformation … “I can’t eat fruit because it has sugar!” “Honey is natural so it’s healthier than sugar.”

Clear up the sugar confusion once and for all with our Sugar Math PowerPoint show that comes with speaker’s notes, handouts, and clipart.

Your audience will learn how to do the math when it comes to sugar:

  • How to calculate sugar limits by calorie intake
  • How to find added sugars on the Nutrition Facts panel
  • How to translate grams of sugar to teaspoons of sugar
  • How to tally up their daily sugar intake

And they’ll learn about:

  • Foods and beverages that are high in added sugars
  • How to spot hidden sugars
  • Simple swaps to lower sugar intake
  • Why cutting down on sugar is important to health

If you want to do it yourself, why not visit the Dietary Guidelines for Americans and show how the limit for refined sugar is 10% of calories per day?

Discussion points: what is refined sugar, and what is 10% of calories per day for most people? Look at a few popular food labels and discuss how these foods can fit. Ask the audience what they would do on 10% calorie budget for their sugar intake. Do beverages make sense?

By Hollis Bass, MEd, RD, LD

PDF Handout: Sugar Math

Stick to the Message on Added Sugar

As we await the release of the 2020-2025 Dietary Guidelines, this is a good time to review key parts of the 2015 guidelines that aren’t likely to change much. One of these topics is added sugar.

Specific sugar intake recommendations were included in the Dietary Guidelines for the first time in 2015 (whereas in years earlier they only recommended avoiding consuming too much sugar or moderate intake of sugar). The message: consume no more than 10% of daily calories from added sugar.

Sugar continues to be a hot issue. When the 2020 Dietary Guidelines Advisory Committee last met on March 12-13 (source), subcommittees presented their DRAFT conclusion statements. Here are a few related to added sugars:

  • Mean intakes of added sugar have significantly decreased over time, but remain high across age, sex, race-ethnic and income.
  • There is a notable increase in the intake of added sugars when 1-year-olds are compared with babies less than 12 months of age.
  • Nearly 70% of added sugars come from five food categories: sweetened beverages, desserts & sweet snacks, coffee & tea (with their additions), candy & sugars, and breakfast cereals & bars.
  • A large percentage of daily sugar intake comes from beverage consumption: 30% for young children, 50% for adolescents, and 60% for adults.
  • The top beverage sources of added sugars: regular soft drinks, fruit drinks, sports/energy drinks, smoothies, and coffee and tea with added sugars.

So what messages about sugar do we need to keep sharing?

  1. Clear up sugar confusion. Consumers may not get it — ‘Doesn’t milk have sugar?! Fruit has sugar!’ But when it comes to sugar, ‘added’ is the key word. Don’t worry about the naturally occurring sugar in REAL food when there’s so much added sugar in PROCESSED food.
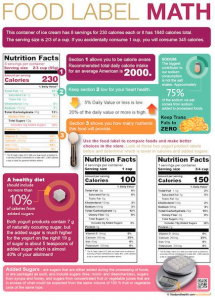
  2. The new Nutrition Facts label is key! We no longer have to arm our clients with long lists of ingredients that actually mean sugar. Added sugar is now on the label – we just need to remind folks to look for it. See our New Food Label materials for ideas on how to do this.
  3. To understand the food label, you have to understand Sugar Math. Teach clients and students how to get from “10% of daily calories” to the grams of sugar shown on the new Nutrition Facts panel.
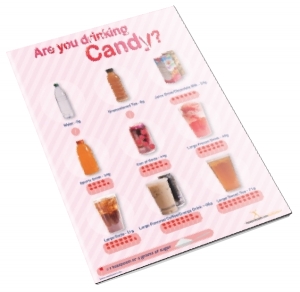
  4. Beverages matter. Choosing water and sugar-free drinks can make a big difference in your sugar intake. We have lots of materials on this — a favorite being Are You Drinking Candy?
  5. Switch to fruit for dessert. This is a great way to satisfy a sweet tooth without a lot of sugar. We even have a Fruit Tooth Dessert Cookbook!
  6. Start early for a lifelong low sugar habit. We want to be raising sugar-free kids who eat real food. Parents, grandparents, and childcare providers need our help. Check out our 0 to 5 Baby and Toddler Nutrition PowerPoint show.
  7. There’s no room for added sugar with MyPlate! Use resources from ChooseMyPlate.gov or see all the materials we have.


Top 10 Foods for Better Health

A new study out of Boston suggests that focusing on 10 specific foods in your diet may cut the risk of premature death from diabetes, stroke, and cardiovascular disease by almost half.

The author of the study, Renata Micha from the Friedman School of Nutrition Science and Policy at Tufts University says that about 45% of US deaths in 2012 could be traced to eating too little or too much of certain foods. Her study draws information from previous research done using National Health and Nutrition Examination surveys from 1999 to 2002 and 2009 to 2012. The researchers used food diaries of participants and found that 318,656 deaths out of 702,308 from stroke, heart disease, or type 2 diabetes were based on people eating too much or too little of the following 10 foods or food elements…

Too Much:

  • Sodium
  • Unprocessed red meat
  • Processed red meat (sausage, bacon, hot dogs)
  • Soybean and corn oil
  • Sugar-sweetened drinks

Too Little:

  • Fruits
  • Vegetables
  • Whole grains
  • Nuts and seeds
  • Seafood with omega-3 fatty acids

For example, consuming too much sodium was linked with 66,508 deaths. Poor nut and seed intake was associated with 59,374 deaths. Processed read meat intake was associated with 57,766 deaths, while 54,626 deaths were linked with inadequate fatty fish intake. Minimal vegetable and fruit intake was linked to 53,410 and 52,547 deaths, respectively. Sugar-sweetened drinks were tied to 51,695 deaths.

Demographics also made a difference. For example, men and women fared differently in the study. Women were less likely than men to die from poor diets and younger people were at higher risk than older individuals. Hispanics and blacks had higher risk than whites, and individuals with less education were at higher risk than more educated people.

Deaths from cardiovascular disease decreased by 25% between the two survey periods because of improvements in dietary habits such as eating more polyunsaturated fats, nuts, seeds, whole grains, fruits, and fewer sugar-sweetened drinks.

Consumers can reduce their risk for chronic disease by adopting one dietary habit at a time (such as eating fatty fish twice per week or choosing water over sweetened beverages) and then moving on to another positive habit once they’ve mastered the first. This helps build confidence and motivate people to continue building healthful eating patterns to reduce their risk of chronic disease.

By Lisa Andrews, MED, RD, LD

References:

  1. Micha, Renata, PhD, Penalvo Jose, PhD, Cudhea PhD, et. al. Association Between Dietary Factors and Mortality From Heart Disease, Stroke, and Type 2 Diabetes in the United States. JAMA. 2017;317(9):912-924
  2. Mueller, Noel T., PhD, MPH, Appel, Lawrence J. Attributing Death to Diet Precision Counts. JAMA. 2017;317(9):908-909.

Nutrition Math Quiz

Recently I was asked for STEM nutrition and health materials. Do you ever address STEM topics with your clients?

STEM stands for science, technology, engineering, and math, and these subjects are a priority among many of the educators I know. To add one more resource to your arsenal of STEM topics, I am proud to present this quick nutrition math quiz, which can be used in your next email blast or as an icebreaker for your next presentation (or however else you’d like).

Nutrition Math Quiz:

Question #1: How many ounces of liquid are there in a cup?

A) 4
B) 6
C) 8
D) 1o

Question #2: At what temperature (in degrees Fahrenheit) does water usually boil?

A) 202
B) 212
C) 222
D) 500

Question #3: How many grams of sugar are there in a teaspoon?

A) 4
B) 8
C) 12
D) 16

Question #4: What is the energy density of a pound of flour?

A) 1651
B) 1492
C) 1000
D) 6

Question #5: What is the energy density of a pound of sugar?

A) 1558
B) 1607
C) 1775
D) 2000

BONUS: Compare the energy density of a pound of potatoes with the energy density of a pound of French fries.

Nutrition Math Quiz Answers:

  1. C) 8
  2. B) 212, though altitude affects the boiling point. To calculate the temperature at which water boils in your area, take 1 degree away from 212 for every 500 feet you are above sea level.
  3. A) 4
  4. A) 1651
  5. C) 1775
  6. Bonus: A pound of potatoes has roughly 347 calories, while a pound of French fries has approximately 1,415 calories. The regular potatoes have roughly 1/4 of the energy density of French fries, which makes them the more healthful option because they are lower in calories and empty calories, yet higher in nutrients than their fried counterparts.

Here is a collection of other fabulous STEM resources…


8 Things We Learned About Sugar

Sugar Math PosterWhen the new Dietary Guidelines for Americans (DGA) released their recommendations about sugar intake, we thought they made a lot of sense. After all, the World Health Organization has been recommending a 10% calorie limit on added sugars for over a decade. The DGA committee now recognizes that sugar makes up about 30% of daily calories in our country, so changes are needed to cut down on sugary beverages, snacks, and desserts with added sugars. Treat foods and beverages are no longer treats but daily staples, which in turn is a significant cause of obesity when people are not getting enough physical activity and when high-sugar foods are replacing high-fiber foods that can help people feel more satiated.

Yet if you tell people to keep their sugar intake to 10% of their daily calories, this advice doesn’t necessarily have much real-world meaning.

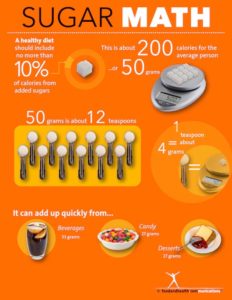
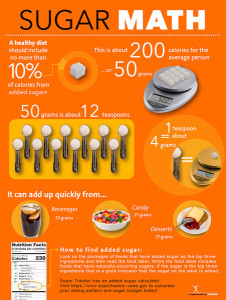
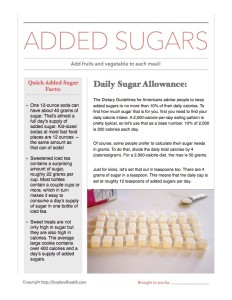
People would have to do a bit of math to figure out how much sugar that that recommendation is allowing for each day. To calculate it, they would first need to land on a daily calorie intake. A 2,000-calorie-per-day eating pattern is pretty typical, so in our example let’s use that as a base number. 10% of 2,000 calories is 200 calories each day. There’s the maximum in an easier format to apply to day-to-day life.

Of course, some people prefer to calculate their sugar needs in grams. To do that, divide the daily total calories from sugar by 4 (calories per gram). For a 2,000-calorie diet, the max is 50 grams.

Just for kicks, let’s set that out in teaspoons too. There are 4 grams of sugar in a teaspoon. That means that the daily cap is set at roughly 12 teaspoons of added sugars per day.

I hope those mathematical measurements can help your clients apply the DGA’s sugar recommendations to their daily lives. You can find all these measurements in the Sugar Math poster, which is what started this entire mathematical exercise.

Of course, the importance of sugar math isn’t the only thing we learned as we were putting the poster together. Here are the top 8 lessons that really made us think as we created that resource…

  1. One 12-ounce soda can have about 40 grams of sugar. That’s almost a full day’s supply of added sugar. Kid-sized sodas at most fast food places are 12 ounces — the same amount as that can of soda!
  2. Regular and large sodas at fast food places are usually equivalent to 2 or more cans of soda.
  3. Sweetened iced tea contains a surprising amount of sugar, roughly 22 grams per cup. Most bottles contain a couple cups or more, which in turn makes it easy to consume a day’s supply of sugar in one bottle of iced tea.
  4. Sweet treats are not only high in sugar but they are also high in calories. The average large cookie contains over 400 calories and a day’s supply of added sugars.
  5. Coffee drinks, tea, sodas, snacks, sweetened yogurt, and dessert can easily supply three days or more’s worth of sugar. It all adds up.
  6. A surprise to our team was that a can of soda is equivalent to a serving of candy!
  7. 50 grams can add up quickly, but if we could get to dinner without putting sweetened beverages in our day, then we had a little of our sugar budget left over for a half cup of frozen yogurt. In a typical day, I used the rest of my budget on a cereal bar and jam for a sandwich. Overall, the guideline helped us lower our calories, especially in beverage calories.
  8. It’s a great idea to track what you eat and drink in a day so you can make better choices.

And there you have it! 8 things we learned while putting together the Sugar Math poster. I’m really proud of this poster — it’s a great resource for nutrition and health educators because it lays out key lessons about added sugars in a fun and memorable way.

Want to share these lessons with your clients? From our collection of free printable nutrition education materials comes a new PDF handout all about added sugars!

Free Added Sugars Handout

And here are some other fantastic sugar education resources, straight from the Nutrition Education Store!

Easter Candy and Your Health

Easter is the second biggest candy holiday in the United States.* According to the National Confectioners Association (NCA), over 120 million pounds of Easter candy is purchased each year. This includes 16 billion jelly beans, 90 million chocolate bunnies, and an untold number of marshmallow peeps.

That’s a lot of sugar!

Moreover, according to research from the NCA, 87% of parents will make Easter baskets for their children this year. It’s also interesting to note that 81% of these parents will then steal candy from their children’s baskets.

So, what are parents usually putting in Easter baskets?

  • 89% say Easter candy and chocolate
  • 79% include non-edible items like crayons, stuffed animals, books, and movie passes
  • 46% add candy with “added benefits” like dark chocolate or chocolate with added fruits and nuts
  • 44% fill the baskets with what they call “heathier snacks” such as granola bars or dried fruit
  • 35% include gums and mints

How about you and your clients?  How do you fill the baskets?

That stash of Easter candy can easily put everyone in the family over their recommended sugar intakes for the day. Remember, the Dietary Guidelines for Americans assert that people should “Consume less than 10 percent of calories per day from added sugars.”

Perhaps it’s time to think outside the jelly bean.

A full 11% of the families surveyed by the NCA didn’t add any candy to their baskets, so I’m not being unrealistic when I say it can be done. Although candy is part of Easter traditions, consider at least limiting the amount and types of candy you put in the basket. I do like the idea of chocolate with “added benefits” like nuts. Other healthful food ideas include some 100-calorie snack packs, nuts, dried fruits, little boxes of raisins, and trail mix.

There are lots of suggestions online for non-edible items like marking pens, money, stickers, and toys. Our own Chef Judy has some great ideas for non-candy items that could also promote physical activity and healthful eating. How about replacing at least some of those jelly beans or marshmallow peeps with:

  • Noodles for the pool
  • Jump ropes
  • Balls
  • Bubble supplies with big wands
  • Colorful athletic shoes
  • Activity passes for fun things to do in the area
  • Family board games
  • Pool towels and swim goggles
  • Athletic clothes
  • Frisbees
  • A healthful cookbook
  • Cooking equipment for foodie kids
  • A new reusable water bottle

Anything that gets the kids and family outside and moving or interacting together makes a great stuffer for an Easter basket, and they’ll last longer than candy too!

So, what will you be putting in your baskets this year?

By Cheryle Jones Syracuse, MS, Professor Emeritus at The Ohio State University

* Halloween is the first.

And here are some other fun prizes that you can put into Easter baskets…

Quick Display Idea: Fruit

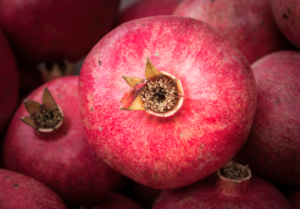
Adding a bit more fruit to an eating pattern is a great way to squeeze in a bunch of nutrients without excess calories, but some fruits are higher in calories than others. In fact, some fruits are even processed in such a way that they come with a boatload of empty calories and added sugars.

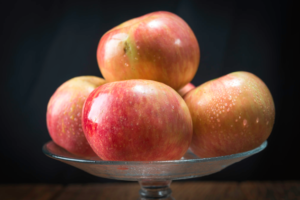
Help your audience navigate the fruit landscape with this quick and pretty display of fruit.

Arrange the following items in a highly-visible part of your space and make cards that list the calorie content of each item. For an activity, have people match the cards to the fruit. For a non-interactive display, simply place each card by the fruit it describes.

  • 1 fresh apple: 71 calories
  • 1 cup apple juice: 116 calories
  • 1 cup canned peaches in juice: 160 calories
  • 1/2 cup raisins: 216 calories
  • 1 cup canned peaches in heavy syrup: 251 calories

This display will show participants that dried fruit and canned fruit in heavy syrup are much higher in calories than their less-processed counterparts.

Variations and Additions:

  • To add more depth to the display, note the fiber content of each item. This is especially useful when comparing the apple and its juice, since a whole apple contains almost 3.5 grams of fiber, while the juice does not contain any fiber at all.
  • For a temporary display or discussion, place actual servings of all the fruit in this list in glass containers on a table. For a more lasting display, use images, food models, or empty packages instead. This can be done on a table or a bulletin board.
  • Instead of comparing total calories or calories per serving, you could also compare sugars, highlighting hidden sources of added sugars in each food.

For other great fruit activity and display ideas, don’t miss these amazing materials!

Display of the Month: Sugar Math

It’s time for a brand-new Display of the Month!

This month, I want to feature Sugar Math: an engaging and memorable way to teach valuable lessons about added sugars and good health.

Let’s dive right in!

The Materials:

The Activities:

August Sugar Math

The Details:

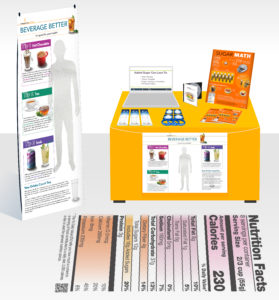
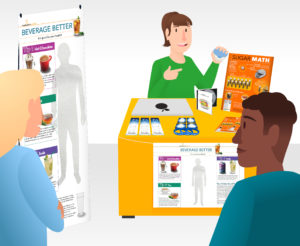
Set up your space as pictured above, adjusting your arrangements to fit the activities you’ve chosen and the space provided.

For the Sugar Quiz, pose the following questions to your group. You can divide them into teams and track points to declare a winner at the end or simply address volunteers individually. Don’t forget to offer Water WristbandsStickers, and Bookmarks as prizes for correct answers or for the winning team.

  1. True or false: A healthy diet should include no more than 10% of its calories from added sugars. (true)
  2. How many calories per day is the upper limit for added sugars for the average person? (200)
  3. And what is that in grams of sugar? (50)
  4. Where can you find added sugars? (on the new nutrition facts label, or point to the general list of sugars in a food and explore how to intuit how much of those sugars is added)
  5. Roughly how many teaspoons of sugar make up the average upper limit for daily added sugar intake? (12)

August Sugar Math Interactive

Now let’s talk about the Yogurt and Added Sugar Measurements Activity. You may need to rearrange your table for this one.

Gather your group around the table and hold up a clean, empty container that was once used to hold yogurt. Ask everyone how much sugar they think was in that container. Take guesses (if people are shy at first, use prizes like the Water WristbandsStickers, and Bookmarks as motivation for contributing), then show them where to find the answer on the label. Hold up a few more containers and repeat the process.

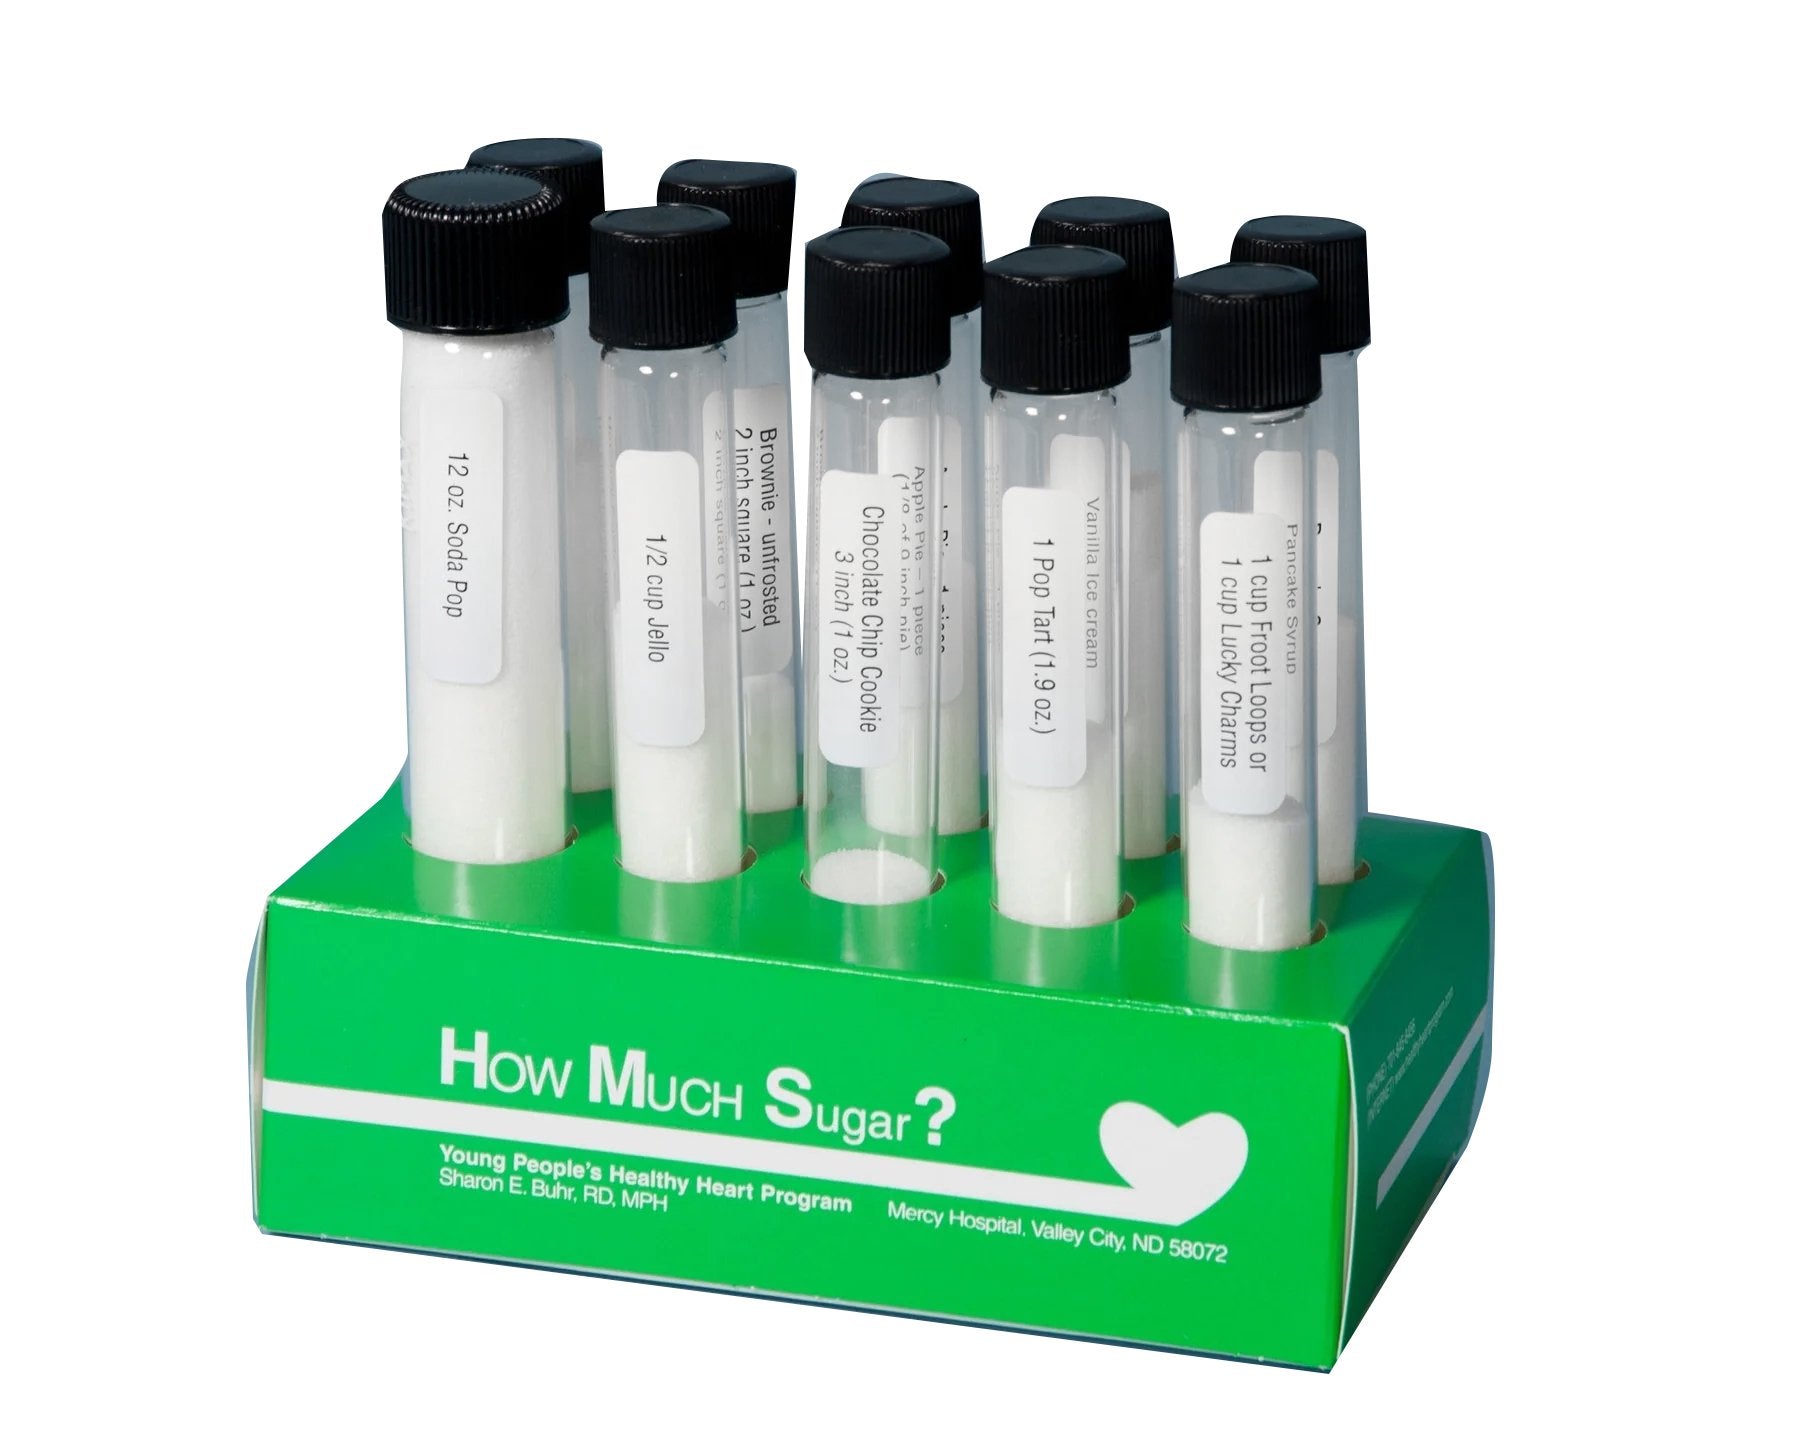
Pick a container of yogurt and have people use a teaspoon to measure out how much sugar is in that container (provide a dish of refined sugar and a few spoons for this purpose) assembling it all in a clear zip-top baggie. You can also use these amazing Sugar Test Tubes.

Do the same thing with the other containers of yogurt, discussing their findings as they go. How much sugar is in that yogurt? How much of it appears to be added sugar? Why?

If you have the resources, a Sugar Presentation is also a fun way to make lessons about added sugars more memorable. Cue up a projector (or your laptop) to show either the Added Sugars DVD or Sugar Scoop PowerPoint, or both! The PowerPoint comes with additional handouts, which you can distribute after the presentation.

Other Display Ideas:

Here is a collection of the past displays of the month. Which will make an appearance at your next health or wellness fair?

And here are some fantastic sugar resources, fresh from the Nutrition Education Store!

Nutrition Poster Guide

Today I want to try something a little different.

I’d like to offer a tour of a few lessons from some of the top posters in the Nutrition Education Store.

You see, 3 different posters have been extremely popular amongst health and nutrition educators recently, and now I want to draw them to your attention. After all, my job is to help you look your very best right now. So let’s take a look at the 3 top posters in the Nutrition Education Store.

Are you ready for this?
Sugar Math PosterPoster #1 is the new Sugar Math Poster. Its key lesson is to limit added sugars. 

How does it teach this lesson?

Through math problems!

You see, sometimes communicating important nutrition messages is a matter of breaking them down into manageable sections, making the information both accessible and memorable.

This poster manages that with varied representations of just how much added sugar people should limit themselves to each day.

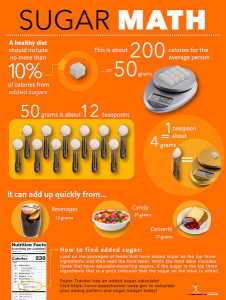
Remember, the Dietary Guidelines for Americans advise people to “Shift to reduce added sugars consumption to less than 10 percent of calories per day.” That 10% is roughly 200 calories for the average person. That’s equal to 50 grams, which in turn is equal to about 12 teaspoons. The Sugar Math Poster features images of each of these amounts in an approach that’s bound to appeal to a wide range of learning styles.

The poster also highlights key sources of added sugars and spells out how to figure out how much added sugar is in a variety of packaged foods. No wonder it’s one of the most popular posters in the store!

Now let’s move on to the next poster.
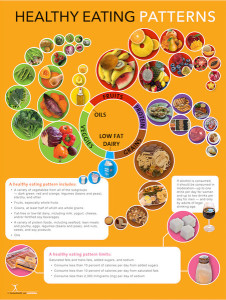
Eating Patterns PosterPoster #2 is the Eating Patterns Poster from the 2015 Dietary Guidelines for Americans series. Its key lesson is to shift into a healthier eating pattern.

As you can see, this poster focuses on what is and is not included in a healthy eating pattern. With beautiful photos placed in a uniquely eye-catching arrangement, this post rocketed to the top of our list practically as soon as it was released.

So why represent healthy foods visually?

The photos demonstrate that healthy eating doesn’t have to be plain and boring. By making the foods that people need to consume look their very best, the photos in this poster add appeal to the eating pattern they’re illustrating. Plus, they provide a pop of color that would be welcome in any office, cafeteria, or display.

How would you use this poster in your life?
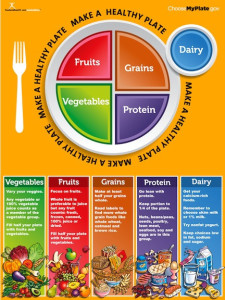
MyPlate PosterFinally, poster #3 is a classic — our very first MyPlate Poster. It teaches a fun way to balance your plate at each meal.

Ever since the USDA released MyPlate in 2011, it has been a popular tool to help educators teach their audiences about proper portions and proportions. As you know, My Plate offers a way to visualize a healthy and balanced plate at each meal, with half the plate filled with fruits and vegetables, grains taking up another quarter, and the remaining quarter of the plate filled with protein foods. A side of dairy rounds out the plate and completes the look.

Each food group has its own lessons and tips, and they all come together to create a healthy eating experience. This poster highlights the most important aspects of MyPlate, illustrating each food group and drawing attention to the key lessons associated with each section of the plate. Its as memorable as it is engaging, and the My Plate poster has been getting rave reviews since we first brought it to the store.

As an added bonus, I’d like to offer you an exclusive look at the handout that accompanies this MyPlate poster. Normally you could only get it if you bought the poster, but I want to make an exception today, so get your free copy of this handout now!
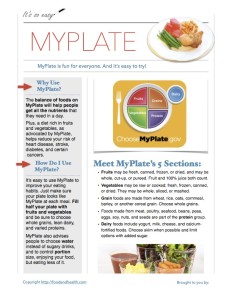
MyPlate Poster Handout

And finally, here are some more of the materials that are at the top of the Nutrition Education Store right now!

12 Lessons of Diabetes Kit

My Plate Handout Tearpad

Cooking Demonstration Kit: Set of 10 Cooking Demo Tools


Display of the Month: Sugar

Set Up Your Display!Let’s start a new tradition, shall we?

Today I want to usher in a brand-new series — the Nutrition Education Store Display of the Month! Each month, we’ll take a look at a new way to display the most important information about a key topic. And, we’ll do it in a way that will engage your clients and make your lessons memorable. What do you think? Are you intrigued?

For the first display, I want to focus on sugar. Here’s what I think will come together to make the best option…

The Materials:

The Activities:

  • Guess how many lollipops would go into a large soda from a fast food chain.
  • Discuss the impact of added sugars on health.

Let’s talk details!

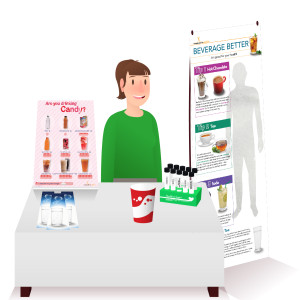
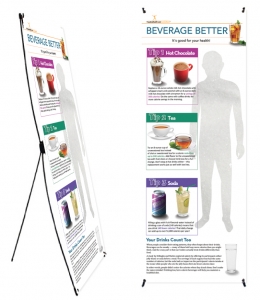
Set up your display area with a table. For an extra aesthetic bonus, cover your table with a plain white tablecloth. Put any chairs you might need behind the table (this comes in handy if you’re manning a booth at a wellness fair — it’s less necessary for a single presentation). On the table, arrange the sugar test tubes wherever you see fit. Add a cardboard easel to hold up a poster for easy viewing, then place the Are You Drinking Candy? poster on top of that easel. Find a spot for the prizes you’ll be handing out — in this case bookmarks and stickers that encourage water consumption over sugary drinks. For the last part of the tablescape, grab a large empty cup from a fast food chain of your choosing and keep it within easy reach. You may also want to have a handful or two of small lollipops. Next to your table, place the Beverage banner on its stand in a place that’s easy for all your participants to see.

Once you’re all set up, you can proceed to the activities.

For the first activity, hold up the large soda container. Ask people to guess how many teaspoons of sugar go into a sugary drink that would fit in this container. Since most lollipops also contain a teaspoon of sugar, you can ask your participants to guess how many lollipops would equal the amount of sugar in one large soda instead. Poll the group, then reveal the answer: on average, a large soda from a fast food chain contains 51 grams of sugar. That’s 12 and 3/4 teaspoons of sugar! (Or, if you’re using lollipops, that’s 12 and 3/4’s lollipops worth of sugar). Hand out prizes to the people whose guesses were closest to that total.

For the second activity, it’s time to talk about the impact of added sugars on health. Introduce information from MyPlate and the Dietary Guidelines for Americans, explaining why moderation is so important when it comes to added sugars. It may also be useful to bring in some of these additional resources…

Additional Resources:

Here are a few blog posts with great handouts, charts, and information about sugar.

And there you have it! The first-ever display of the month! What do you think?

Oh, and here’s a closer look at a few of the resources we highlighted in today’s post. Remember, at the Nutrition Education Store, we’re here to help you look your very best, right now!

Sugar Test Tubes

Handout: Are You Drinking Candy?

Water Bookmarks

PS: Here’s a free PDF handout that you can also incorporate into your display!

Sugar Reduction Handout